About
The Community Health Assessment (CHA) for Marion County, Ohio, was conducted to understand the health needs and challenges of our community. This assessment is a collaborative effort led by Marion Public Health, our local health department, to create a culture of health and provide all residents with the opportunity to reach their greatest health potential at every stage of life.
A majority of data gathered was curated in partnership with Metopio, unless noted otherwise. This allowed us to capture a comprehensive picture of the community’s health status and identify key areas for improvement.
The assessment identified several prioritized health needs, including overall health, health behaviors, socio-economic factors, chronic disease, behavioral health, food access, the built environment, and housing. These needs were selected based on their impact on the community’s health and well-being.
Public Health Accreditation Board (PHAB) Requirements
National Public Health Accreditation status through the Public Health Accreditation Board (PHAB) requires Community Health Assessments (CHAs) to be completed at least every five years. The purpose of the community health assessment is to learn about the community: the health of the population, identify areas for health improvement, identify contributing factors that impact health outcomes, and identify community assets and resources that can be mobilized to improve population health. Marion Public Health received initial accreditation in August of 2018 and reaccreditation in 2024.
PHAB standards highly recommend that national models of methodology are utilized in compiling CHAs. The 2026 CHA was completed using the National Association of County and City Health Officials (NACCHO) Mobilizing for Action through Partnerships and Planning (MAPP) 2.0 process. MAPP 2.0 is a community-driven planning process for improving community health.
Highlights
About Marion
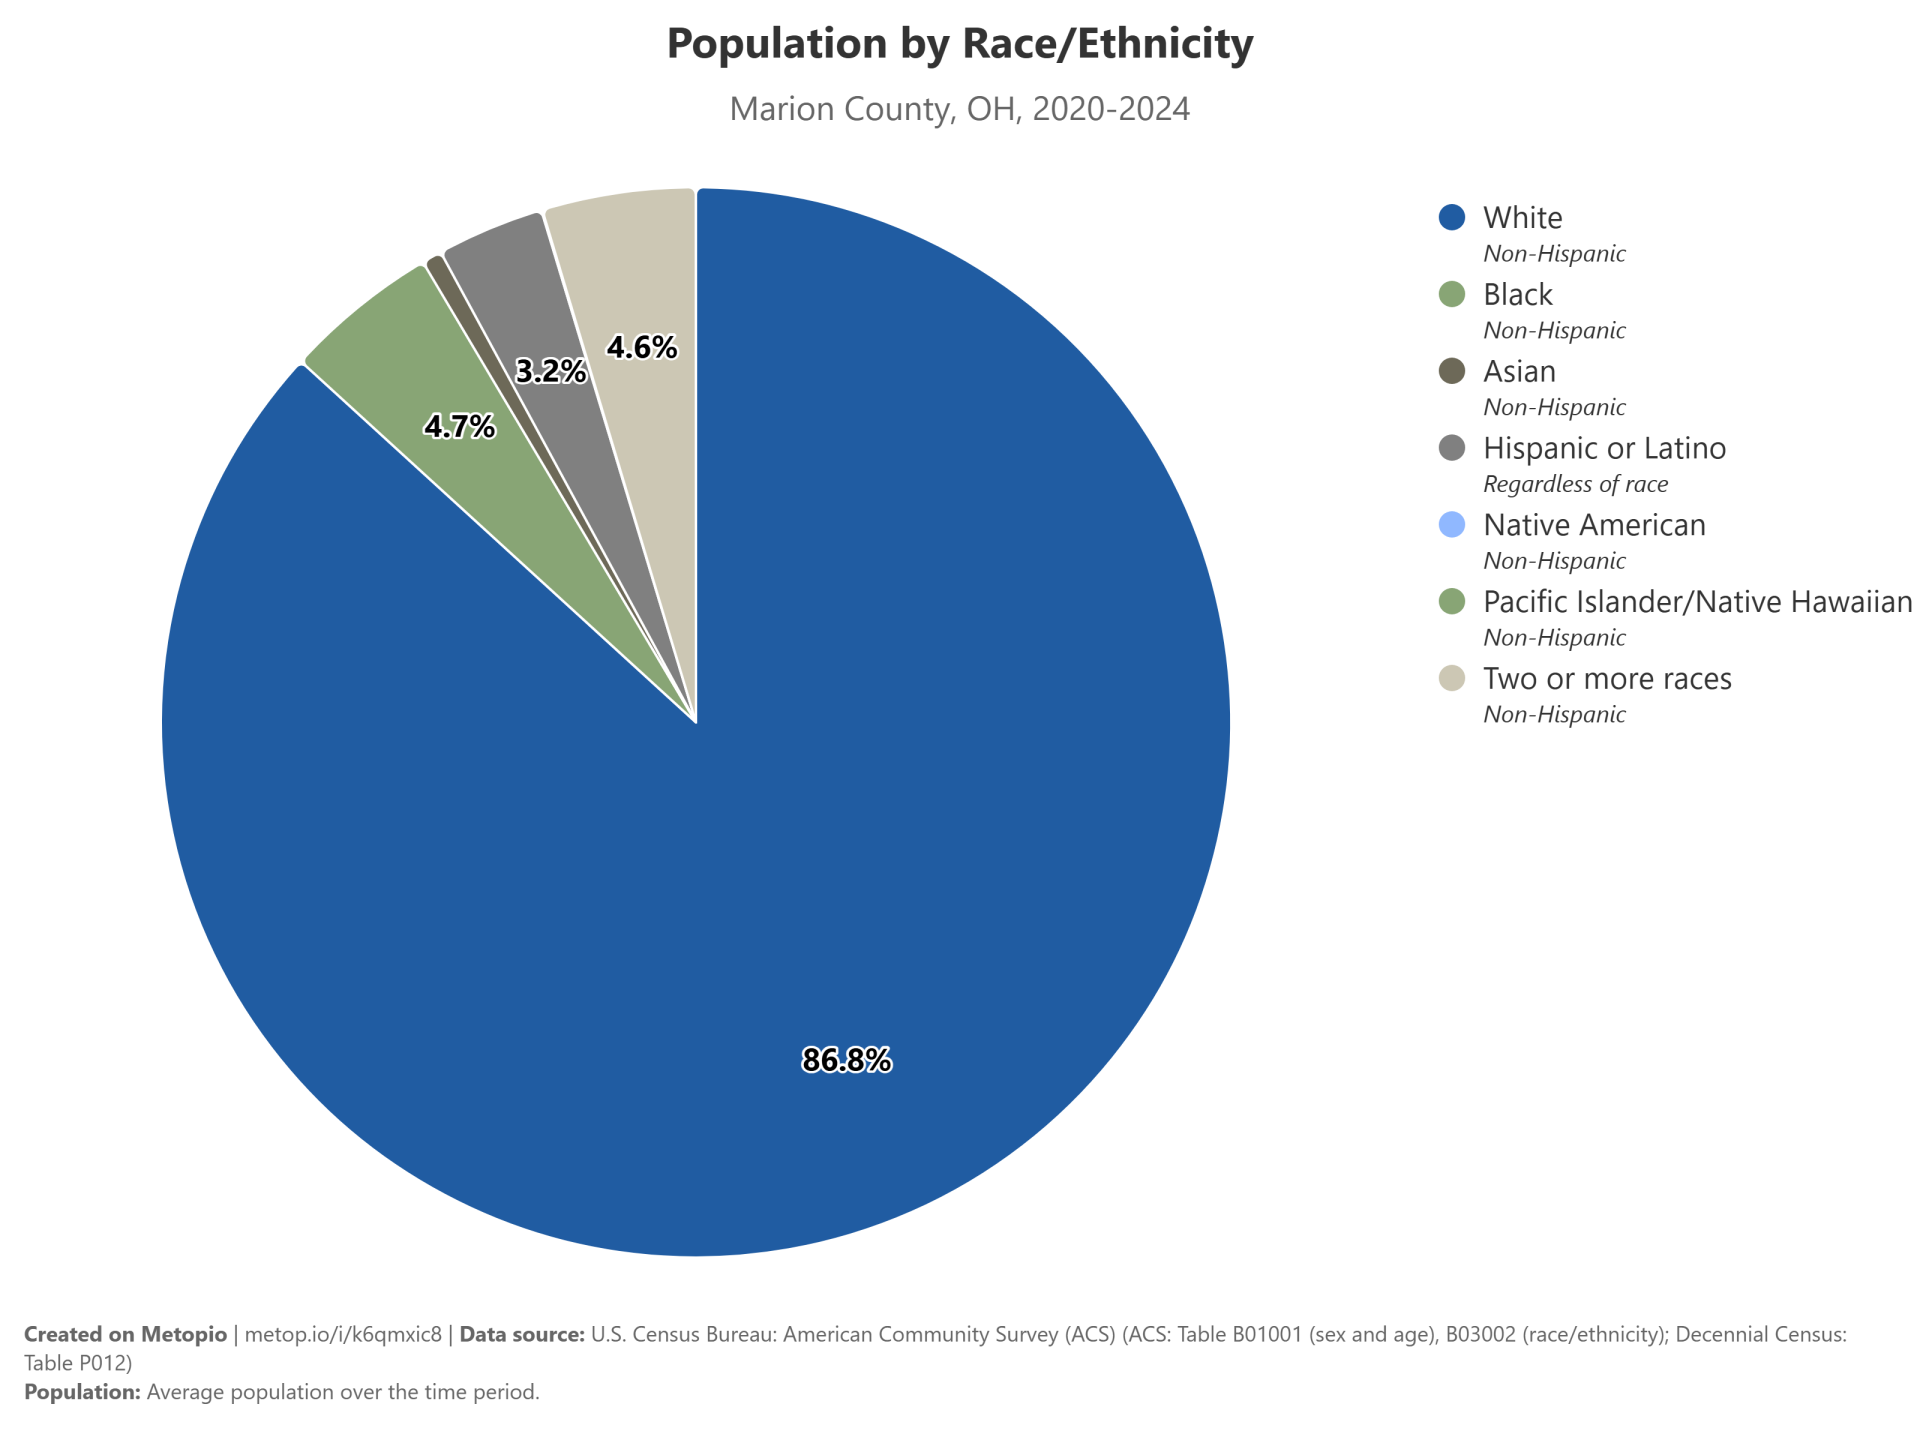
Population by Race/Ethnicity
The population distribution in Marion County shows a predominantly White community, with 56,085 individuals identifying as White. This is significantly higher than the Black population, which stands at 3,035 individuals. The Hispanic or Latino community is also present, comprising 2,098 individuals. Additionally, there are 2,994 individuals of two or more races, 395 Asian individuals, 23 Native American individuals, and no Pacific Islander or Native Hawaiian individuals.
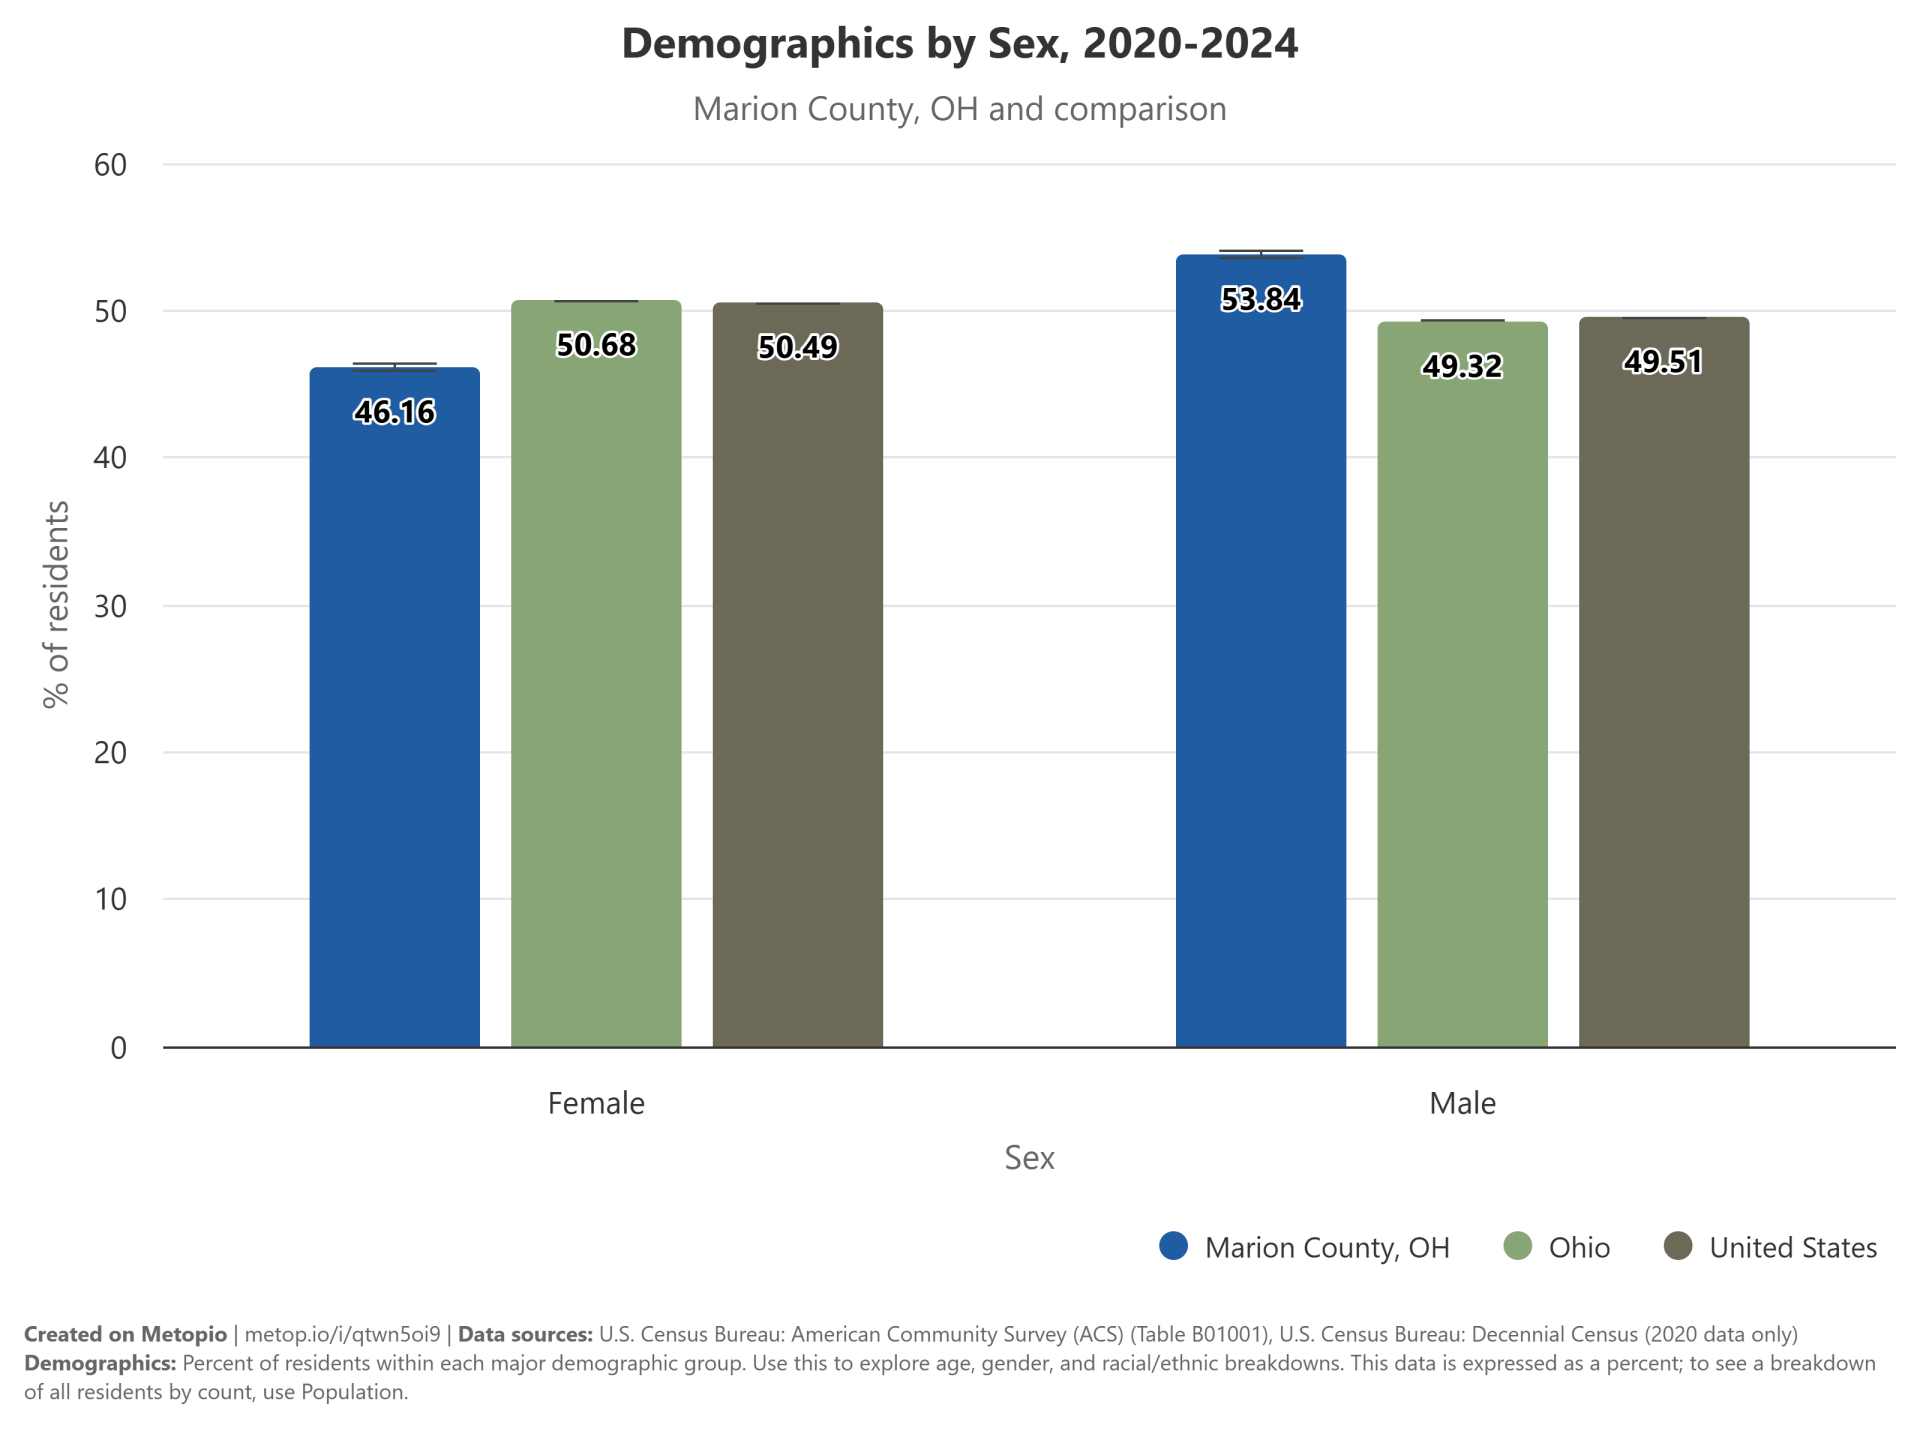
Gender Distribution
In terms of gender, Marion County has a higher proportion of males (53.84%) compared to the overall state of Ohio (49.32%) and the United States (49.51%). Conversely, the female population in Marion County is lower (46.16%) relative to Ohio (50.68%) and the nation (50.49%). This gender imbalance has implications for health services, particularly in areas like reproductive health and gender-specific health programs.
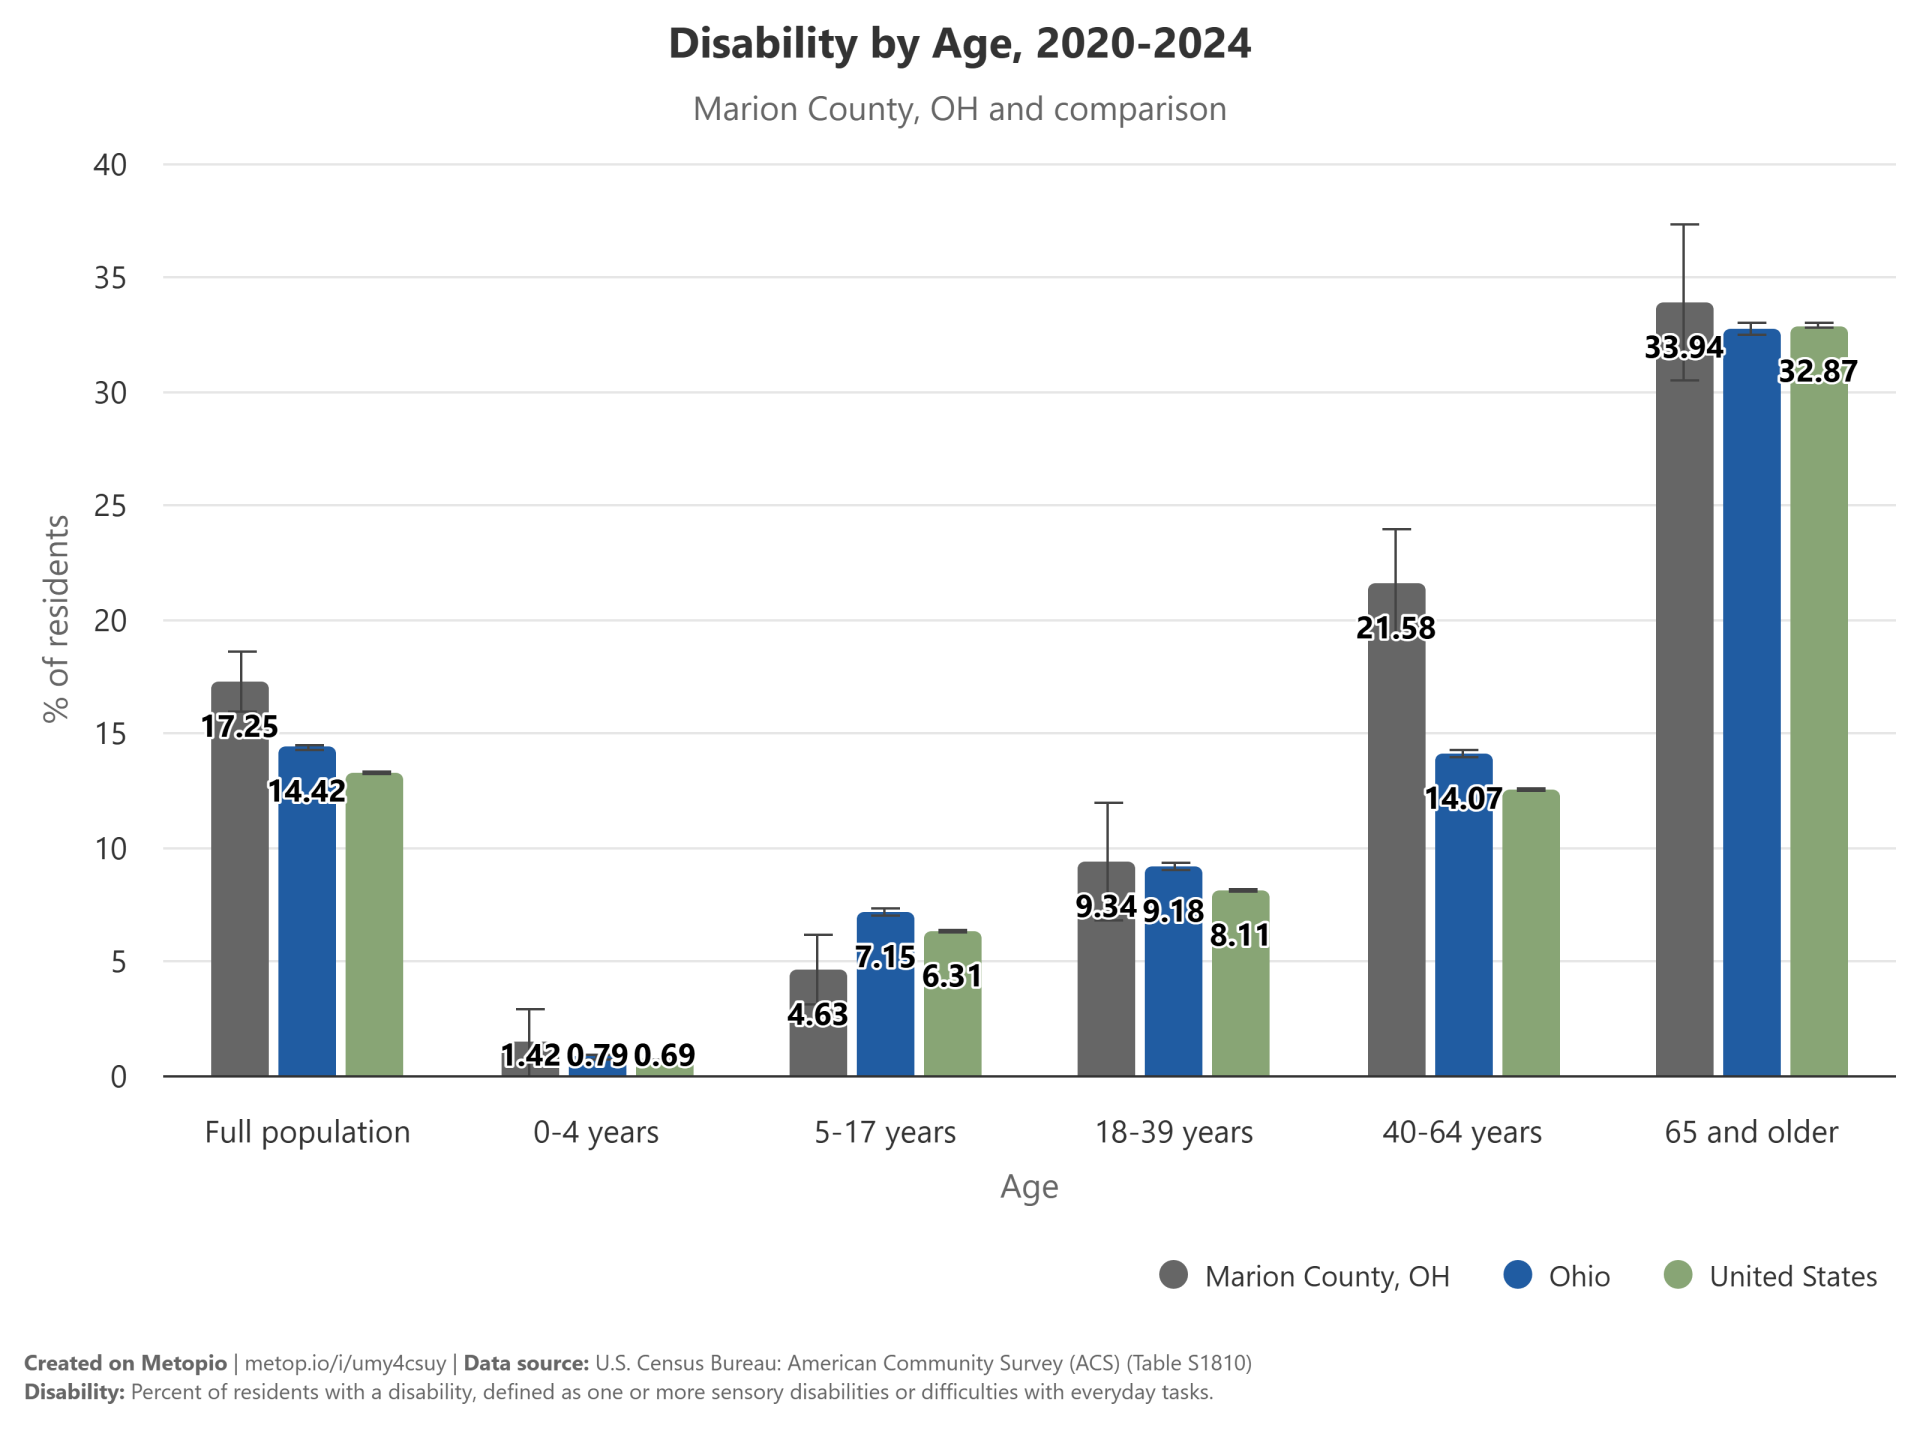
Disability
Disability rates in Marion County are higher than both state and national averages across nearly all age groups. The highest disability rate is among individuals aged 65 and older, at 33.94%. This high prevalence of disability underscores the need for robust support systems and accessible healthcare services tailored to individuals with disabilities.
Health Behaviors
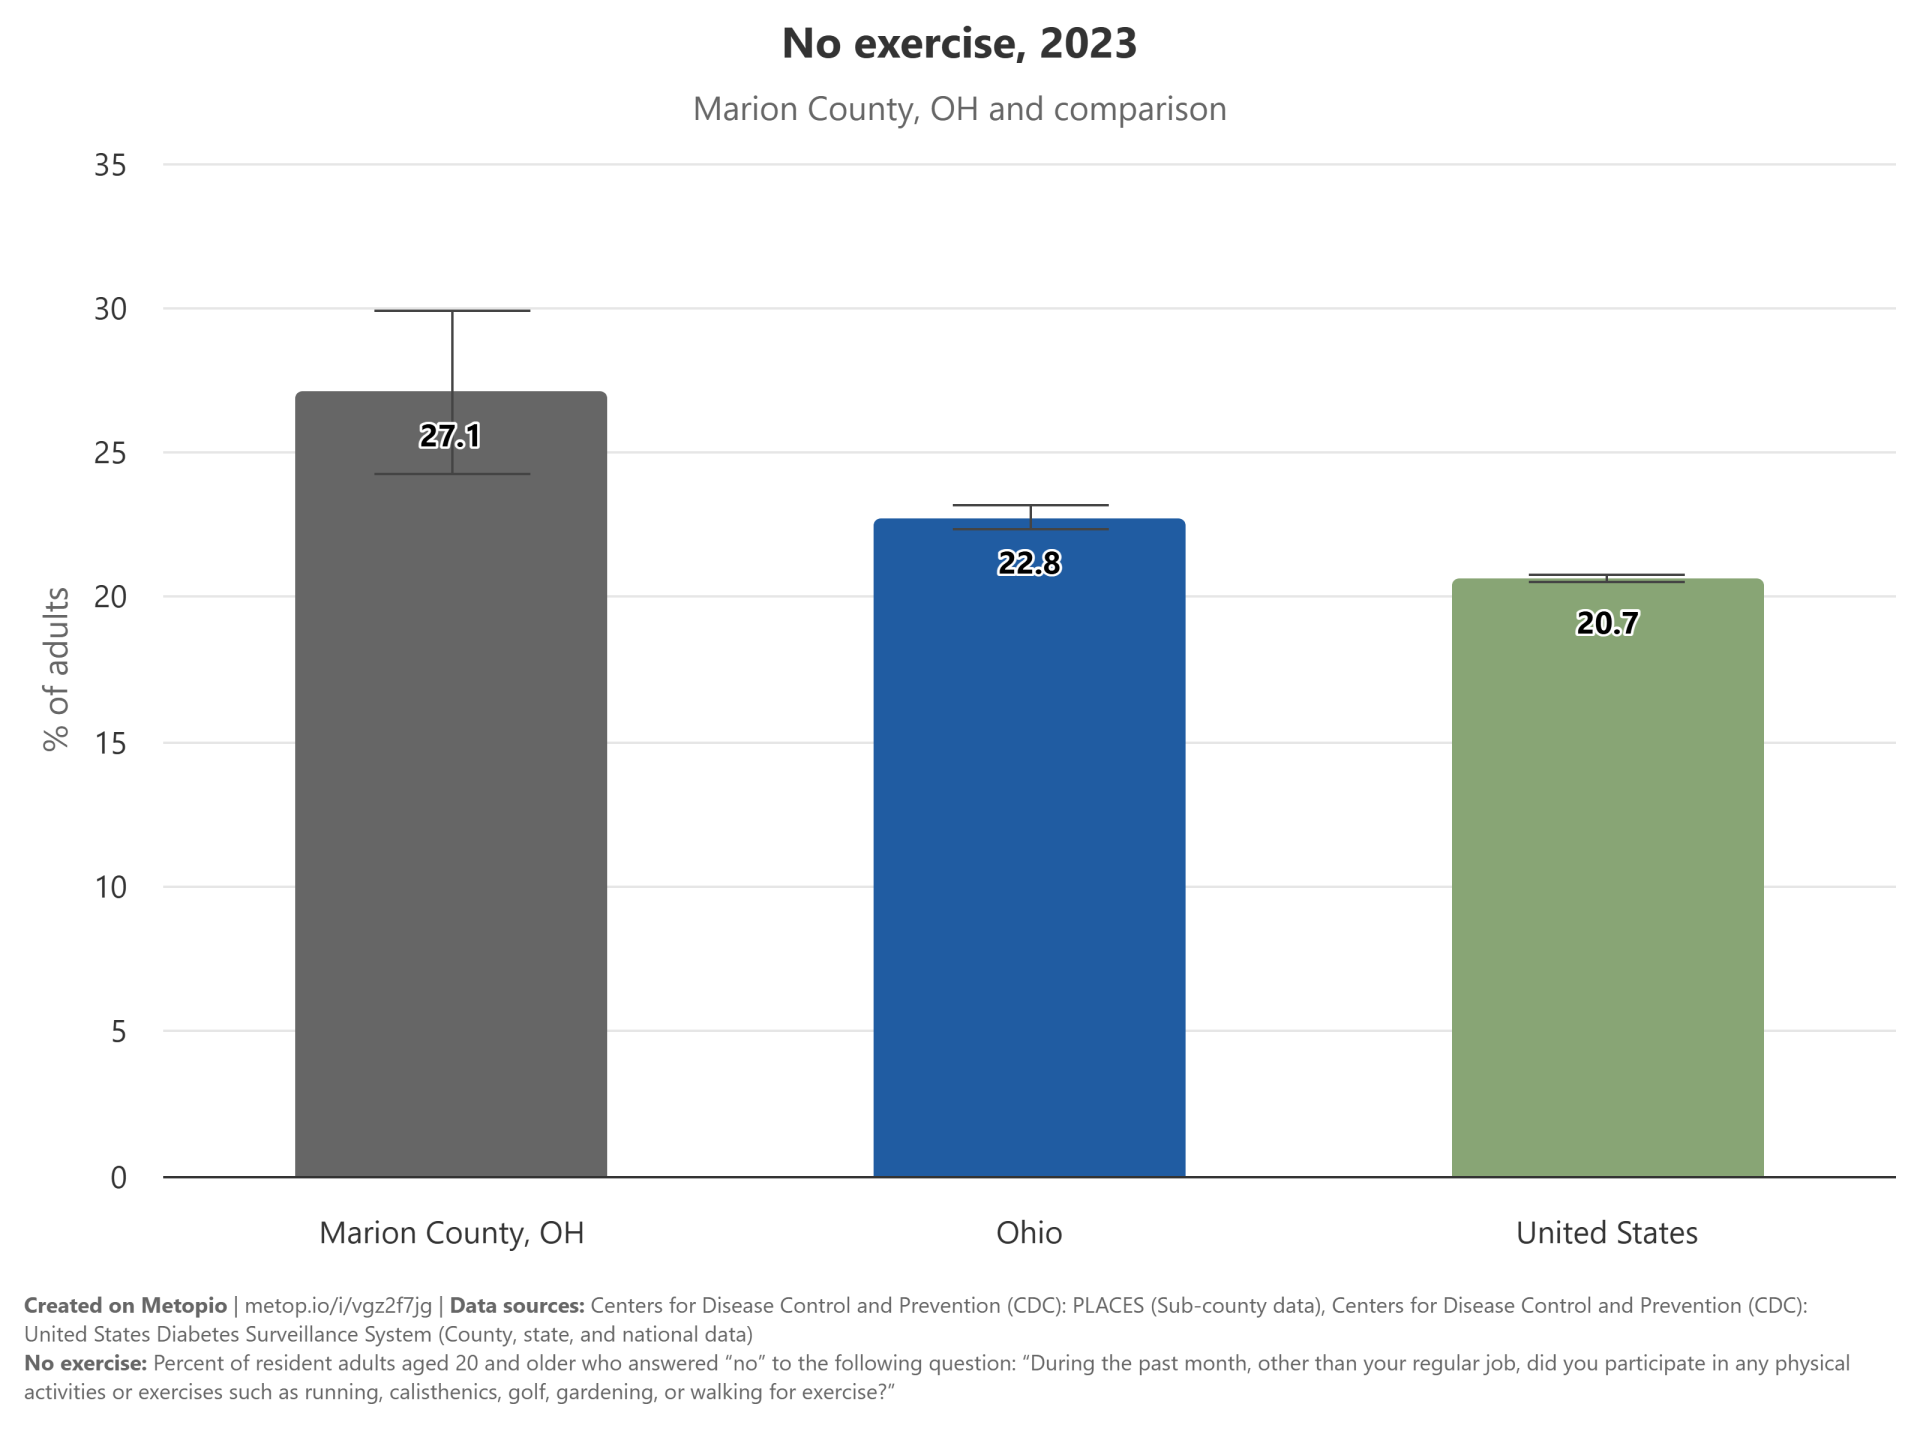
No Exercise
27.1% of adults in Marion County report no exercise, which is in the highest 10% nationally.
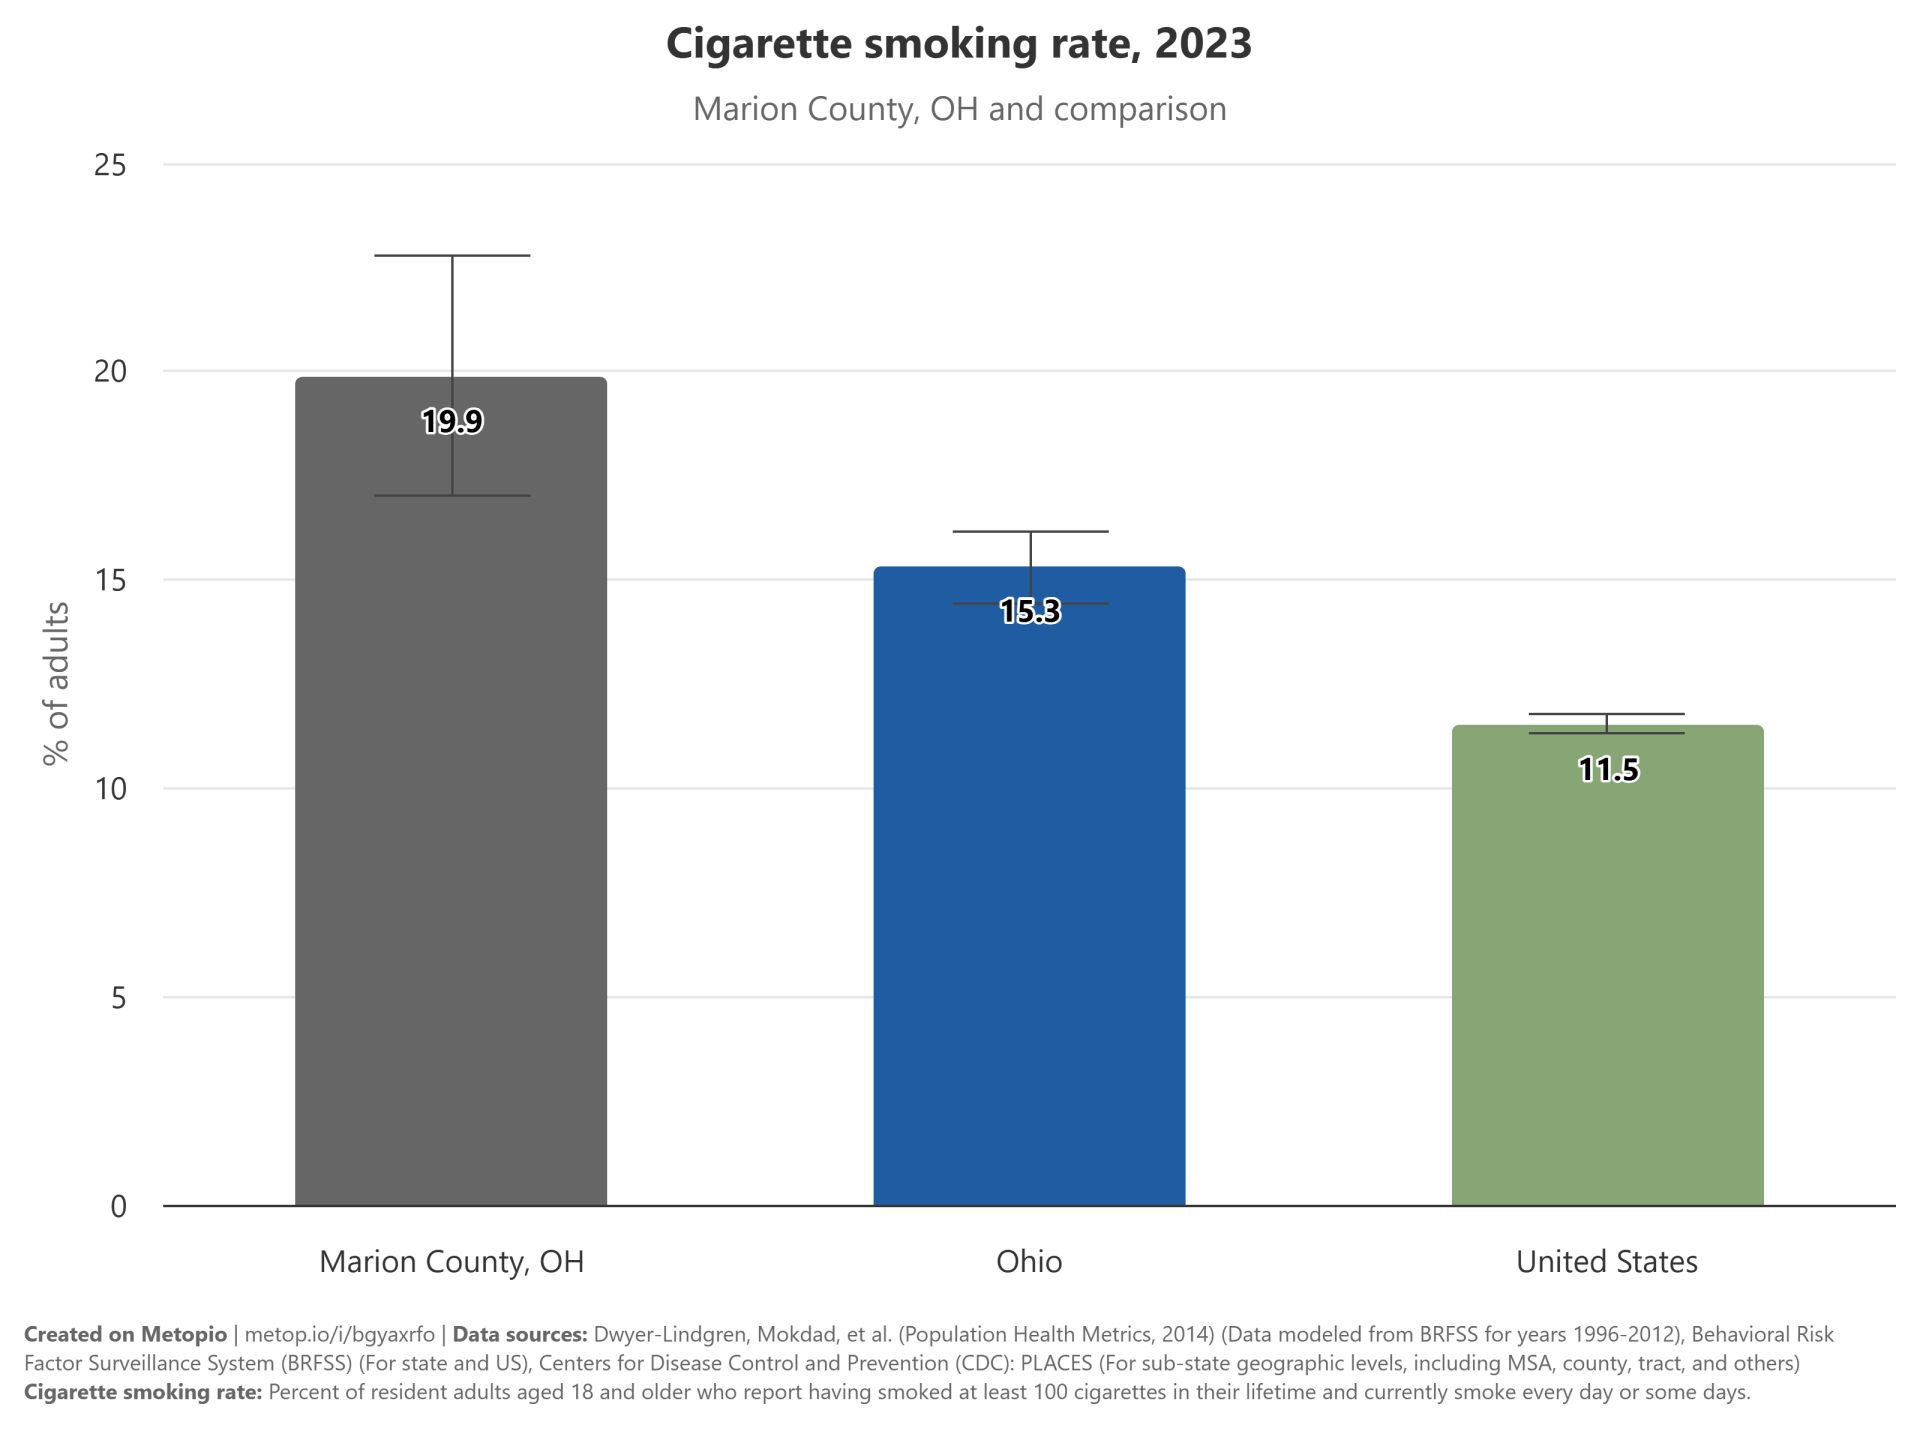
Cigarette Smoking
19.9% of adults in Marion County smoke cigarettes, which is in the top quartile nationally.
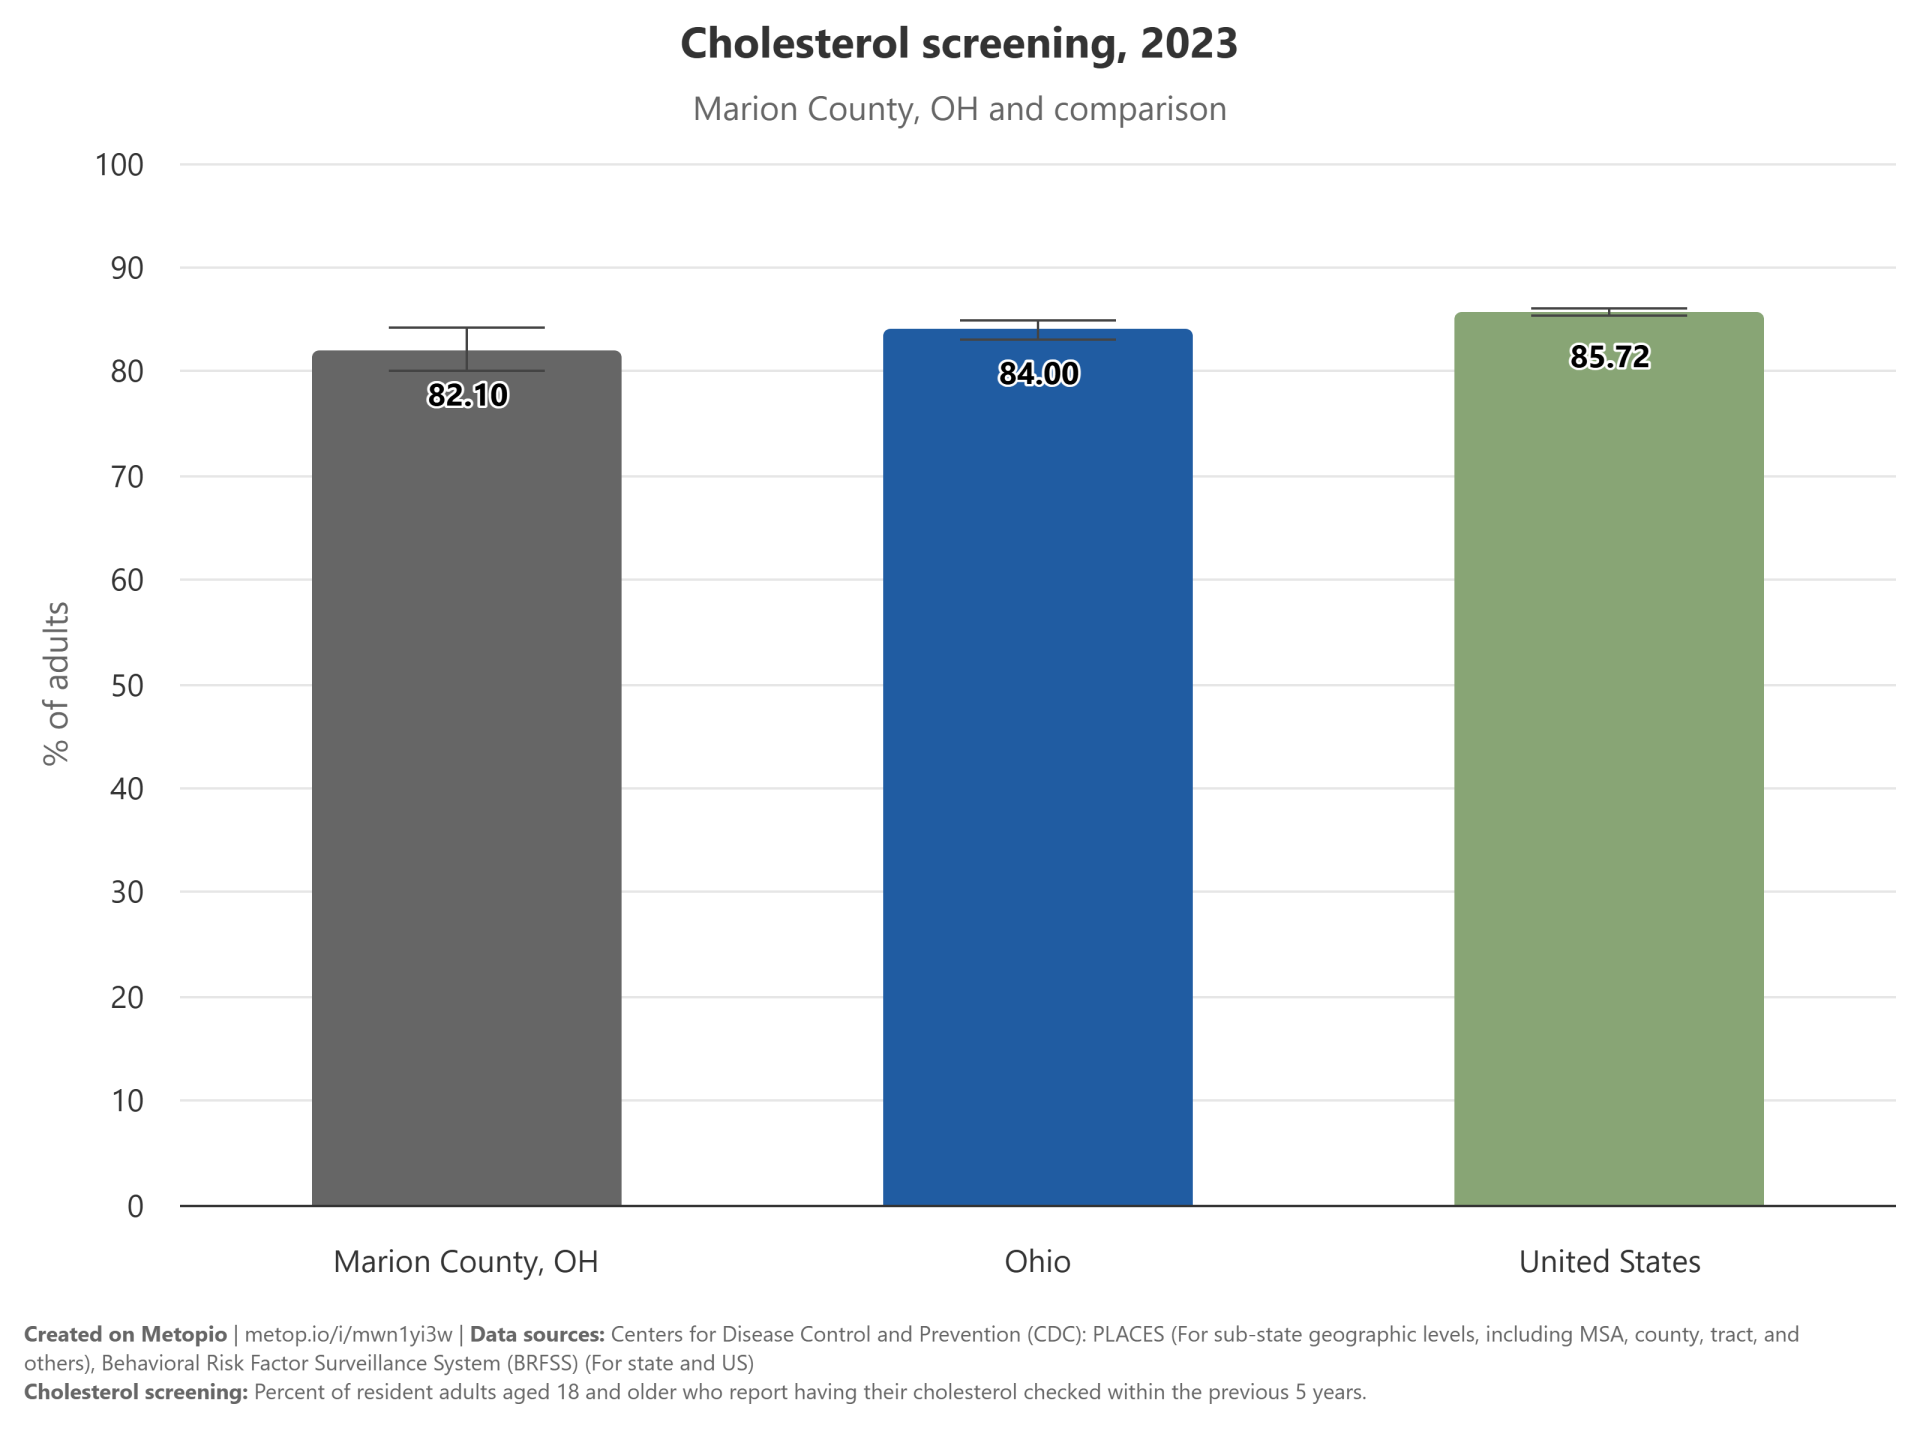
Cholesterol Screening
Cholesterol screening rates in the United States are relatively high, with a national average of 85.72%. Ohio has a slightly lower rate of 84.0%, while Marion County, OH, reports an even lower rate of 82.1%. This indicates a general trend of decreasing screening rates at more localized levels.
Chronic Disease
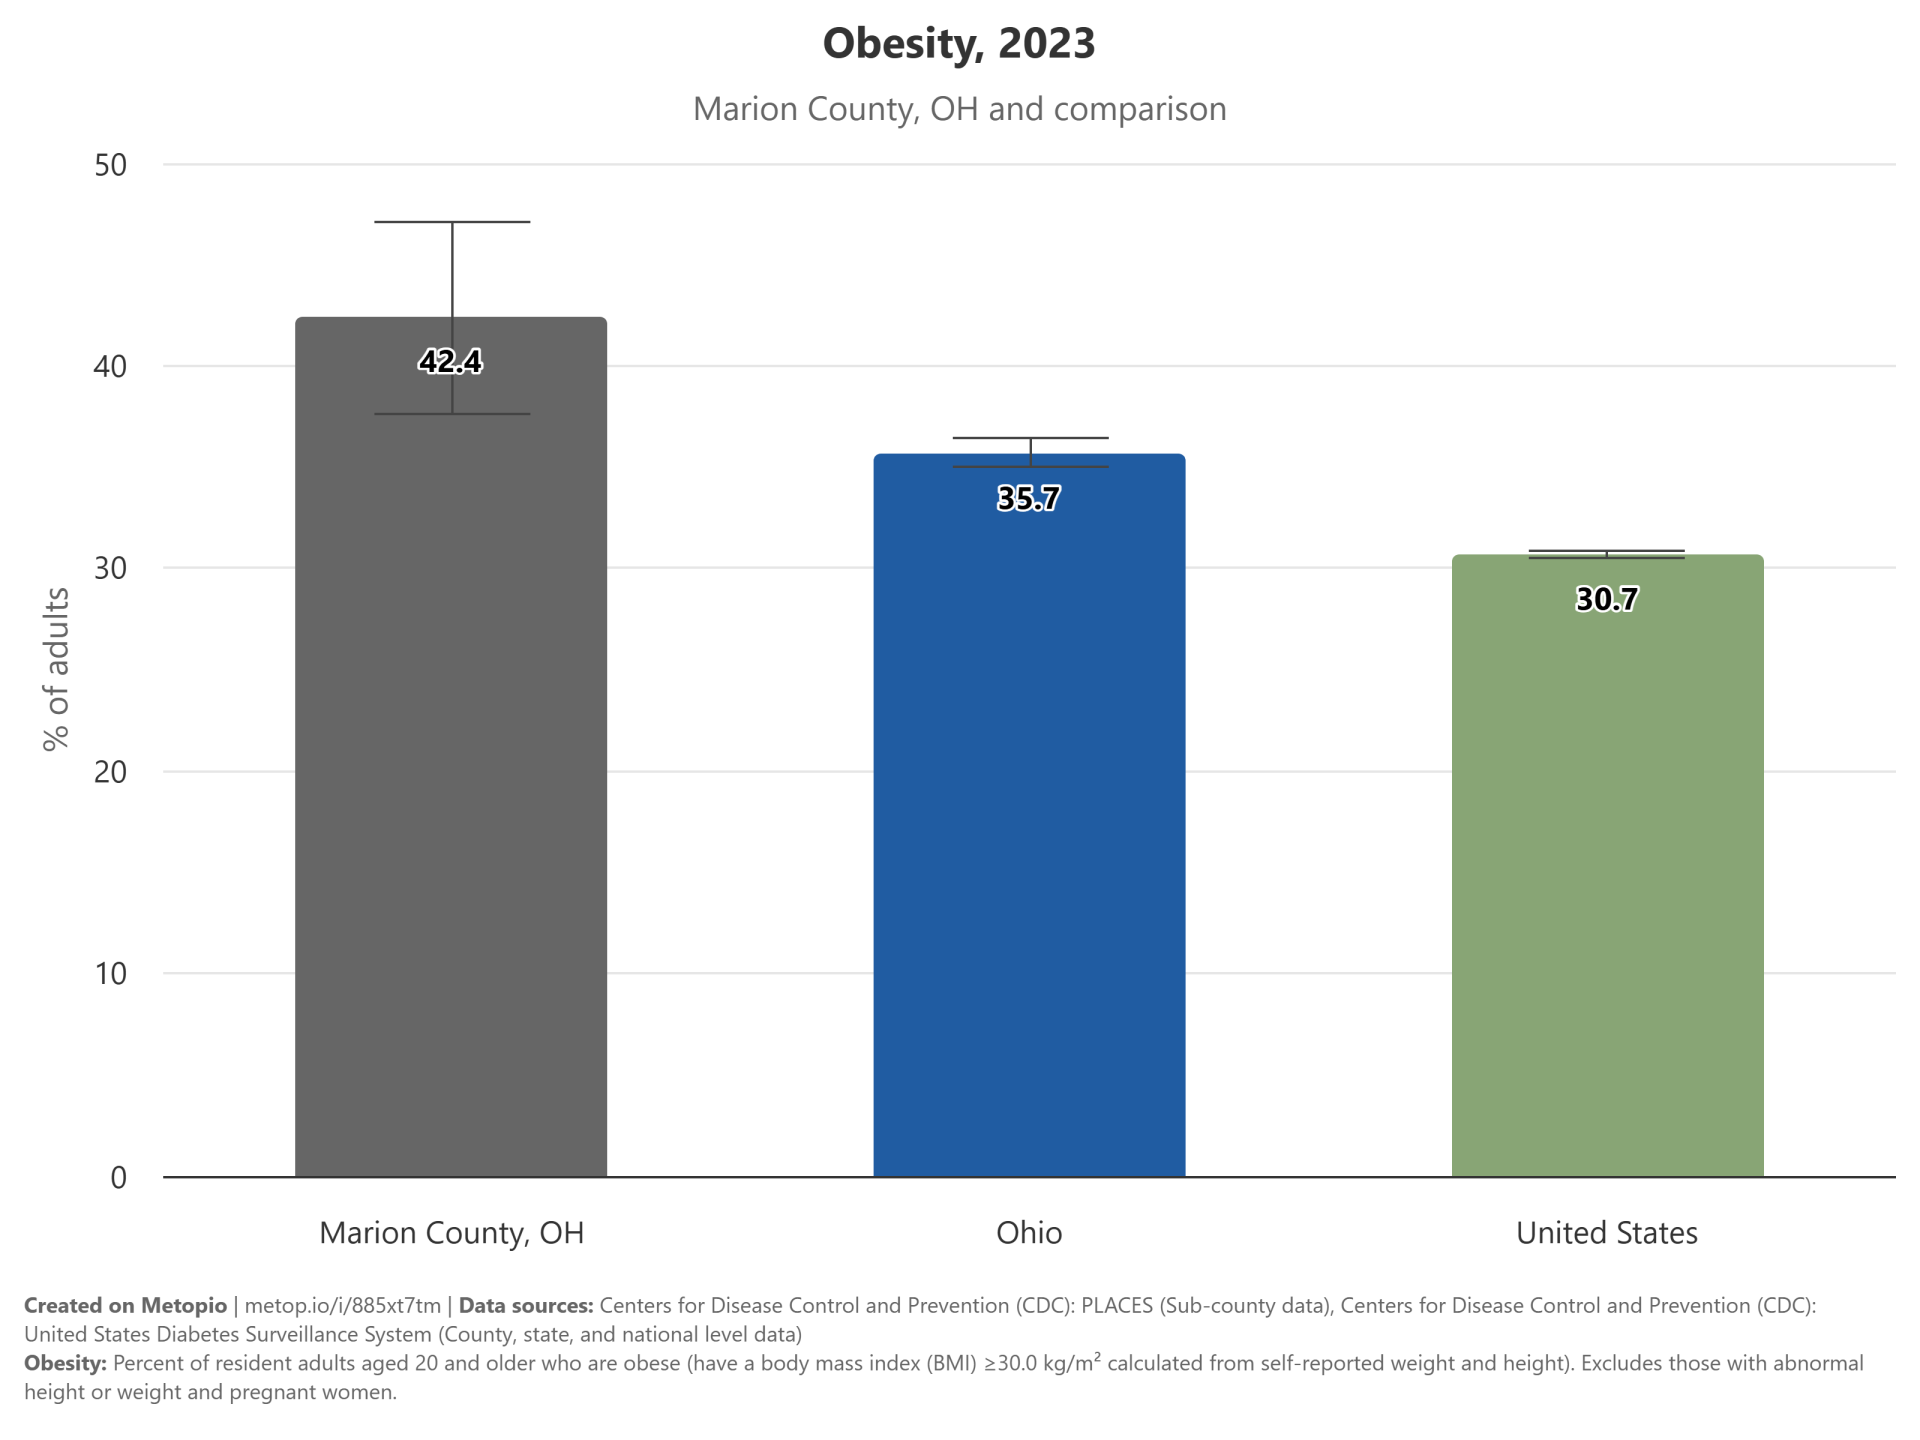
Obesity
Obesity rates vary significantly across different regions, with Marion County, OH, exhibiting the highest rate at 42.4%, well above the state and national averages. Ohio’s obesity rate stands at 35.7%, while the United States has a lower average rate of 30.7%. These disparities highlight the need for targeted interventions in specific areas to address the obesity epidemic.
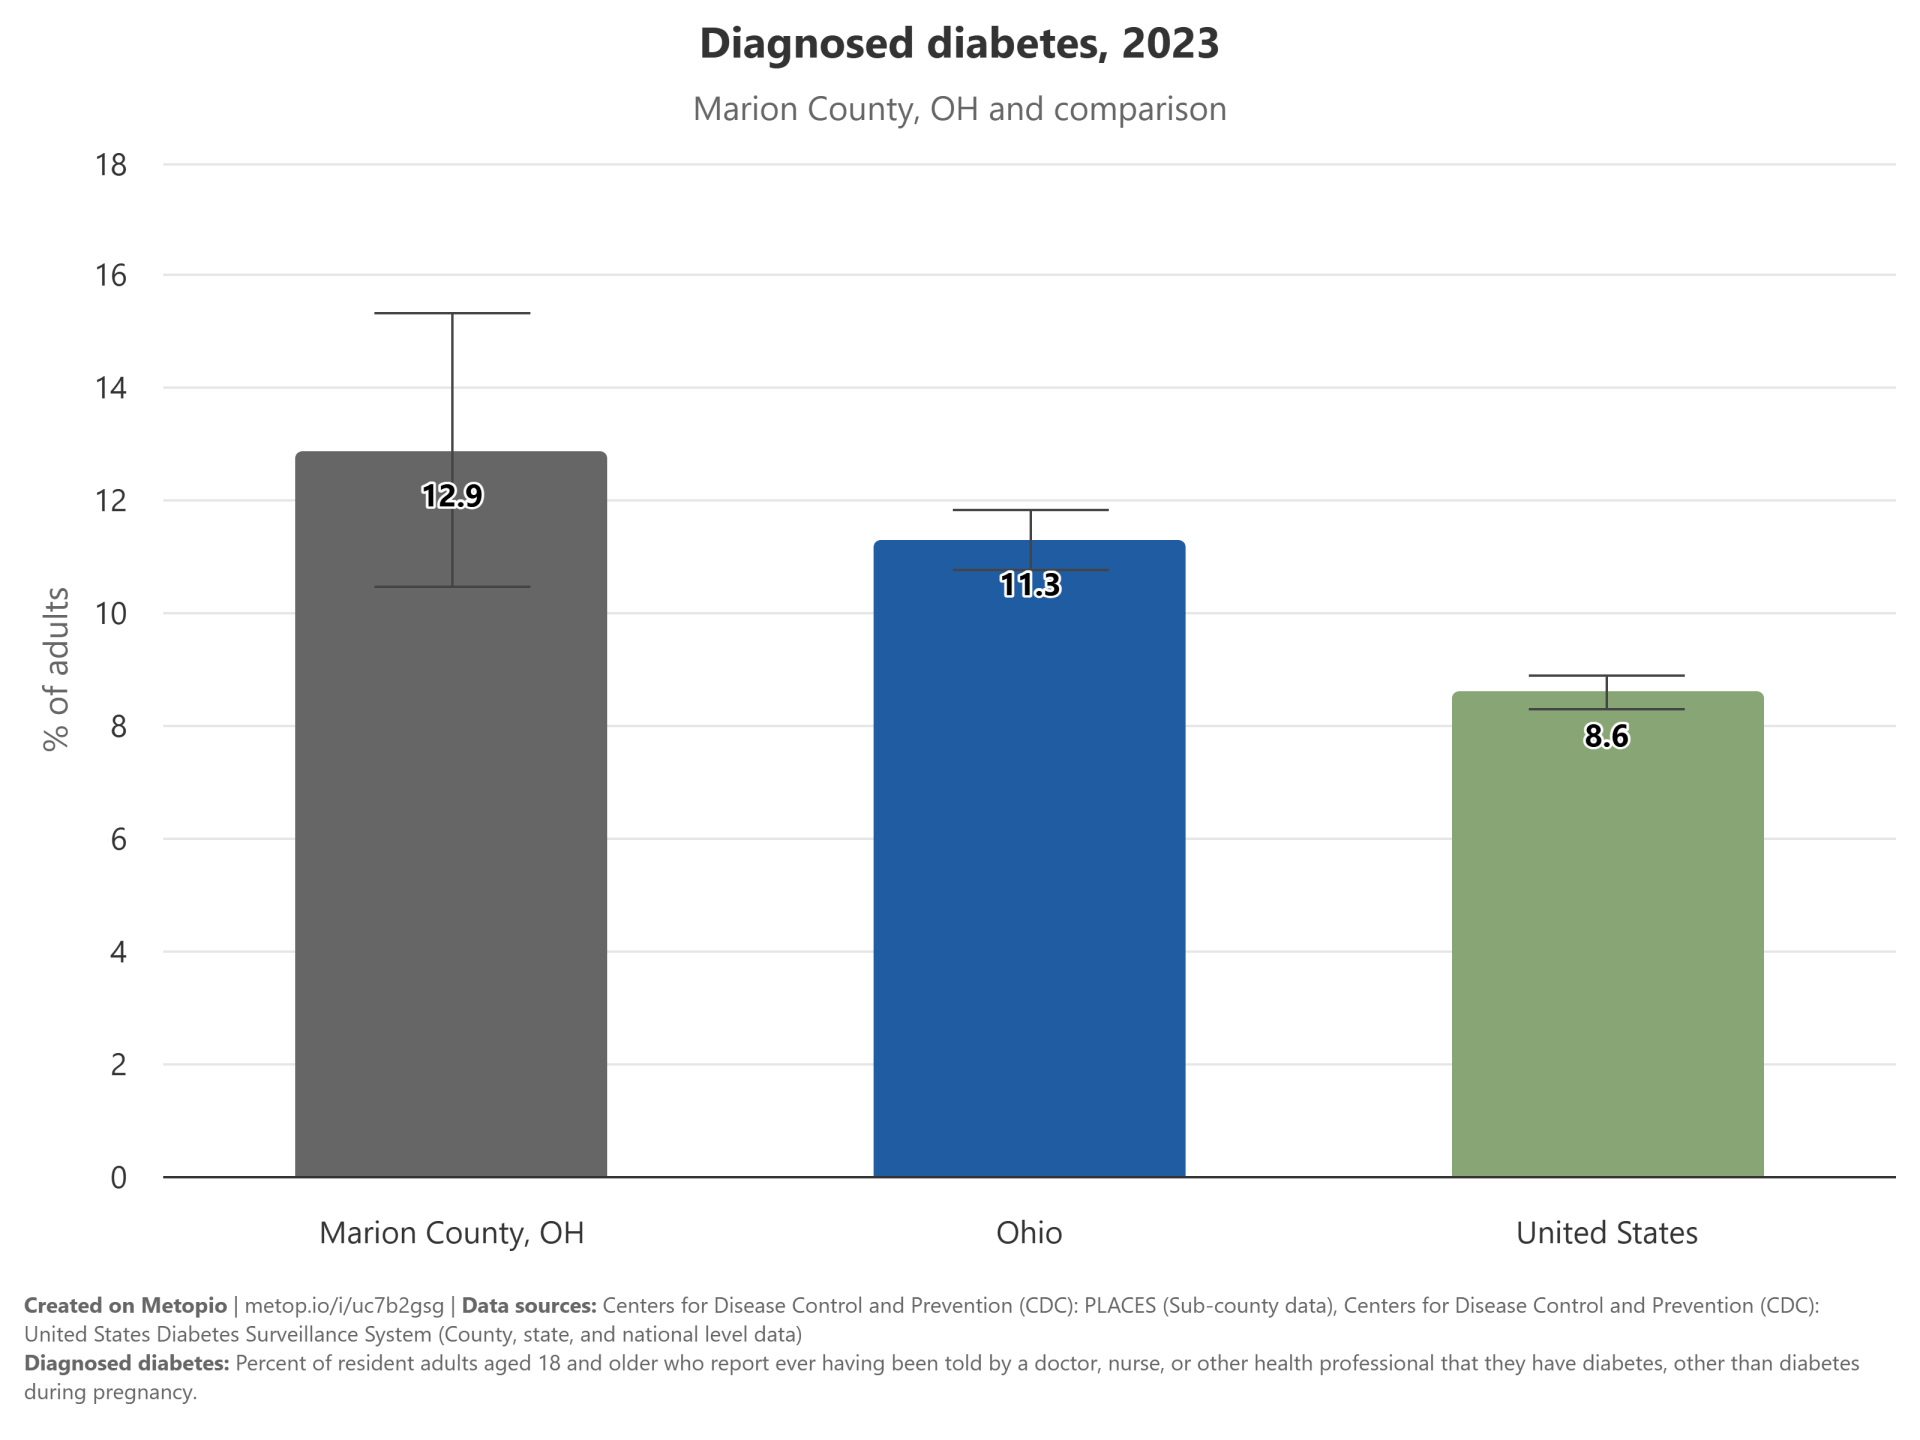
Diabetes
The diagnosed diabetes rate in Marion County, OH is 12.9%, which is higher than the state average of 11.3% and significantly above the national average of 8.6%. This indicates a notable health concern in Marion County compared to broader regions.
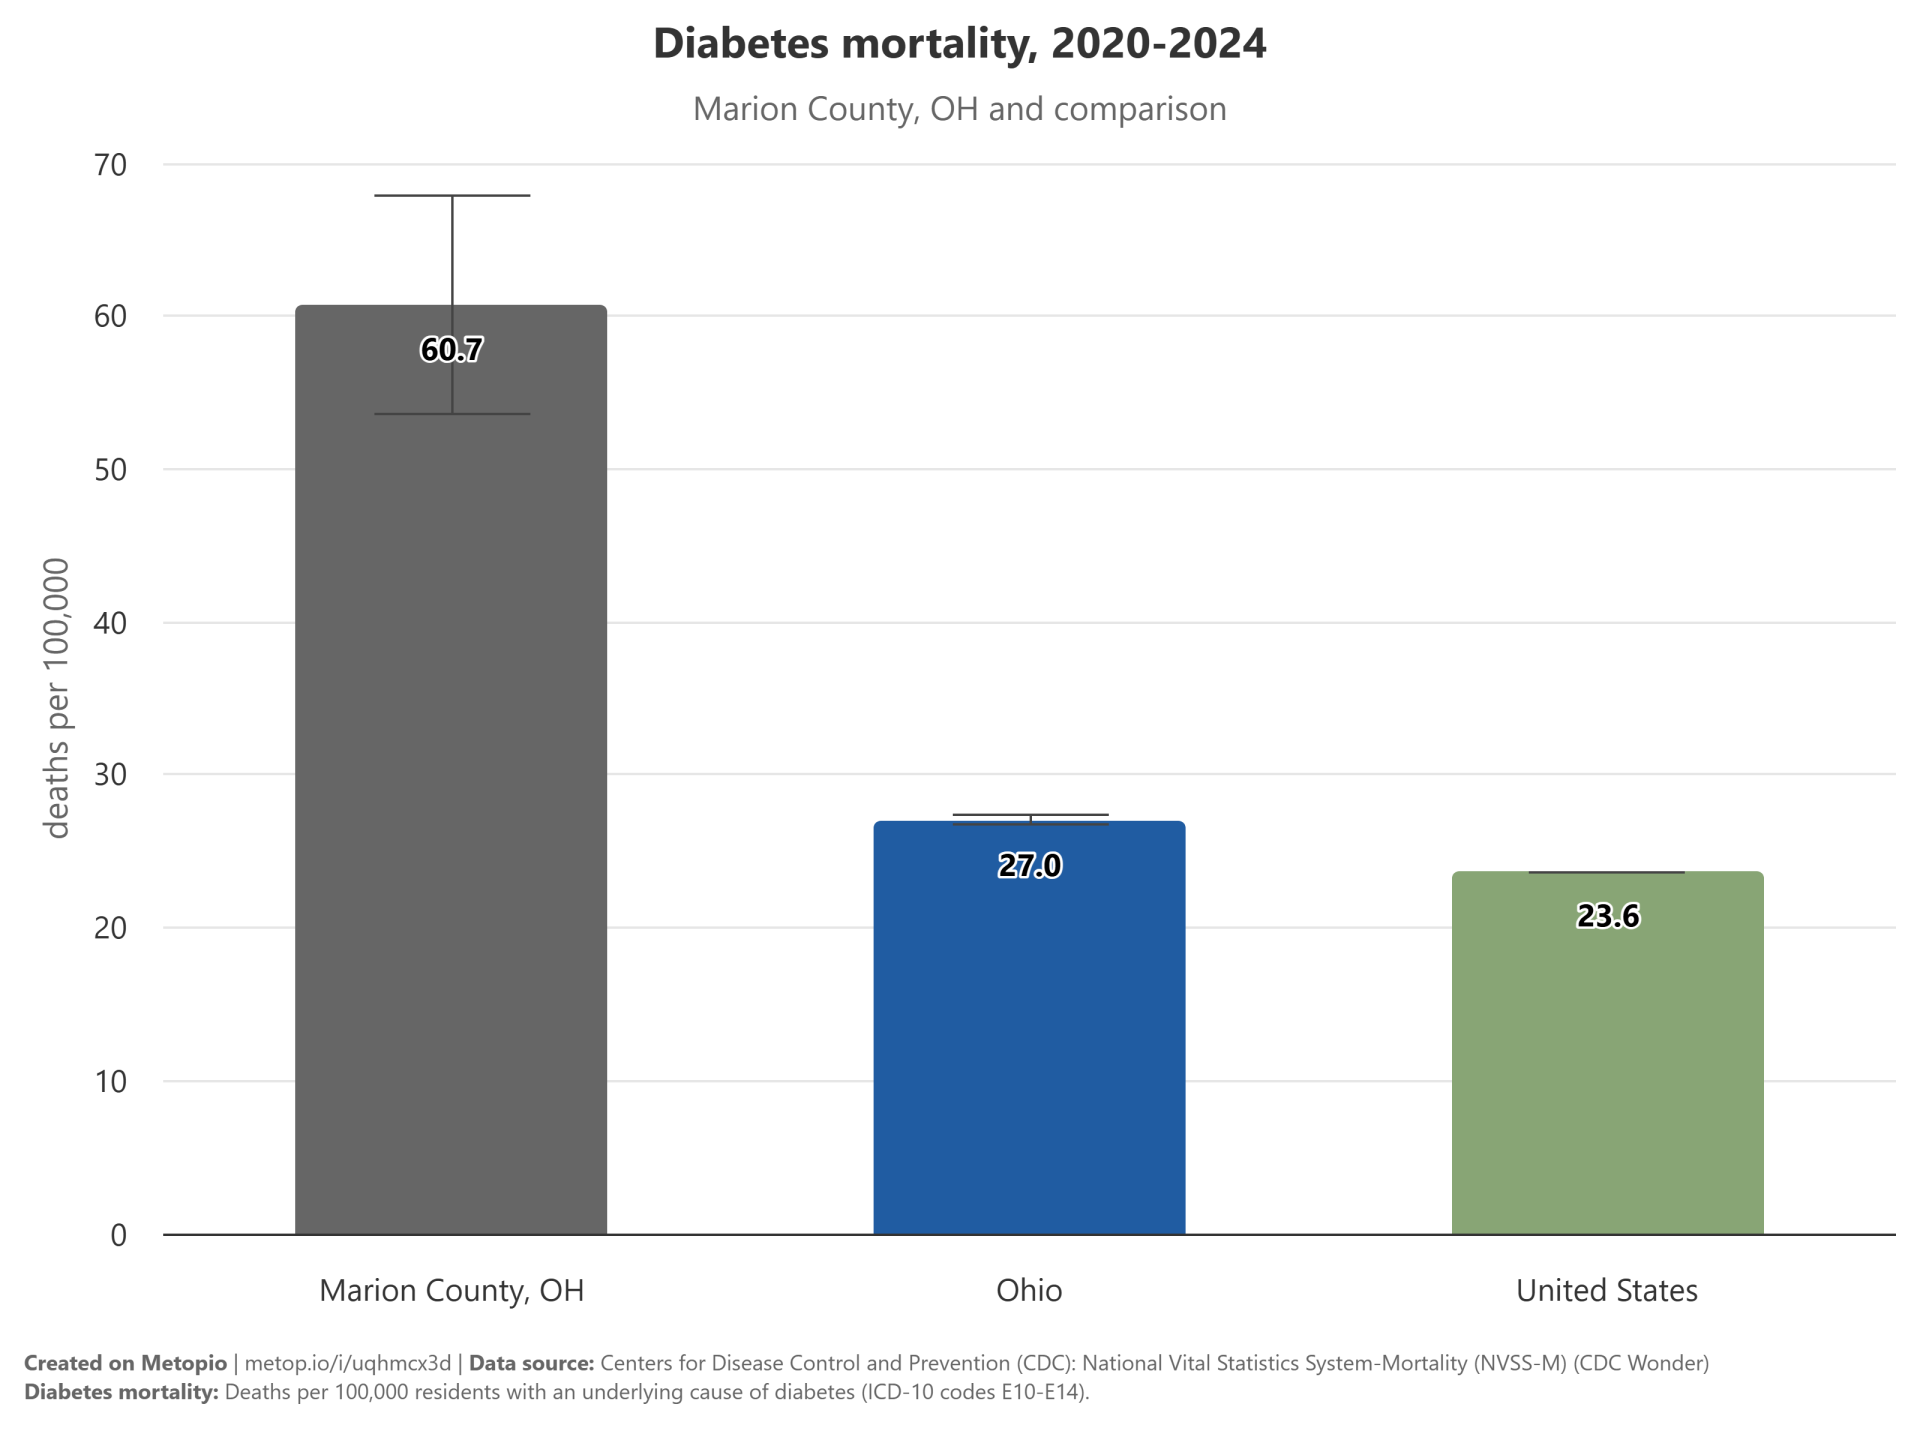
Diabetes mortality in Marion County, OH, is significantly higher than both the state of Ohio and the United States overall. The rate in Marion County is more than double that of the national average. This indicates a notable health disparity in this region.
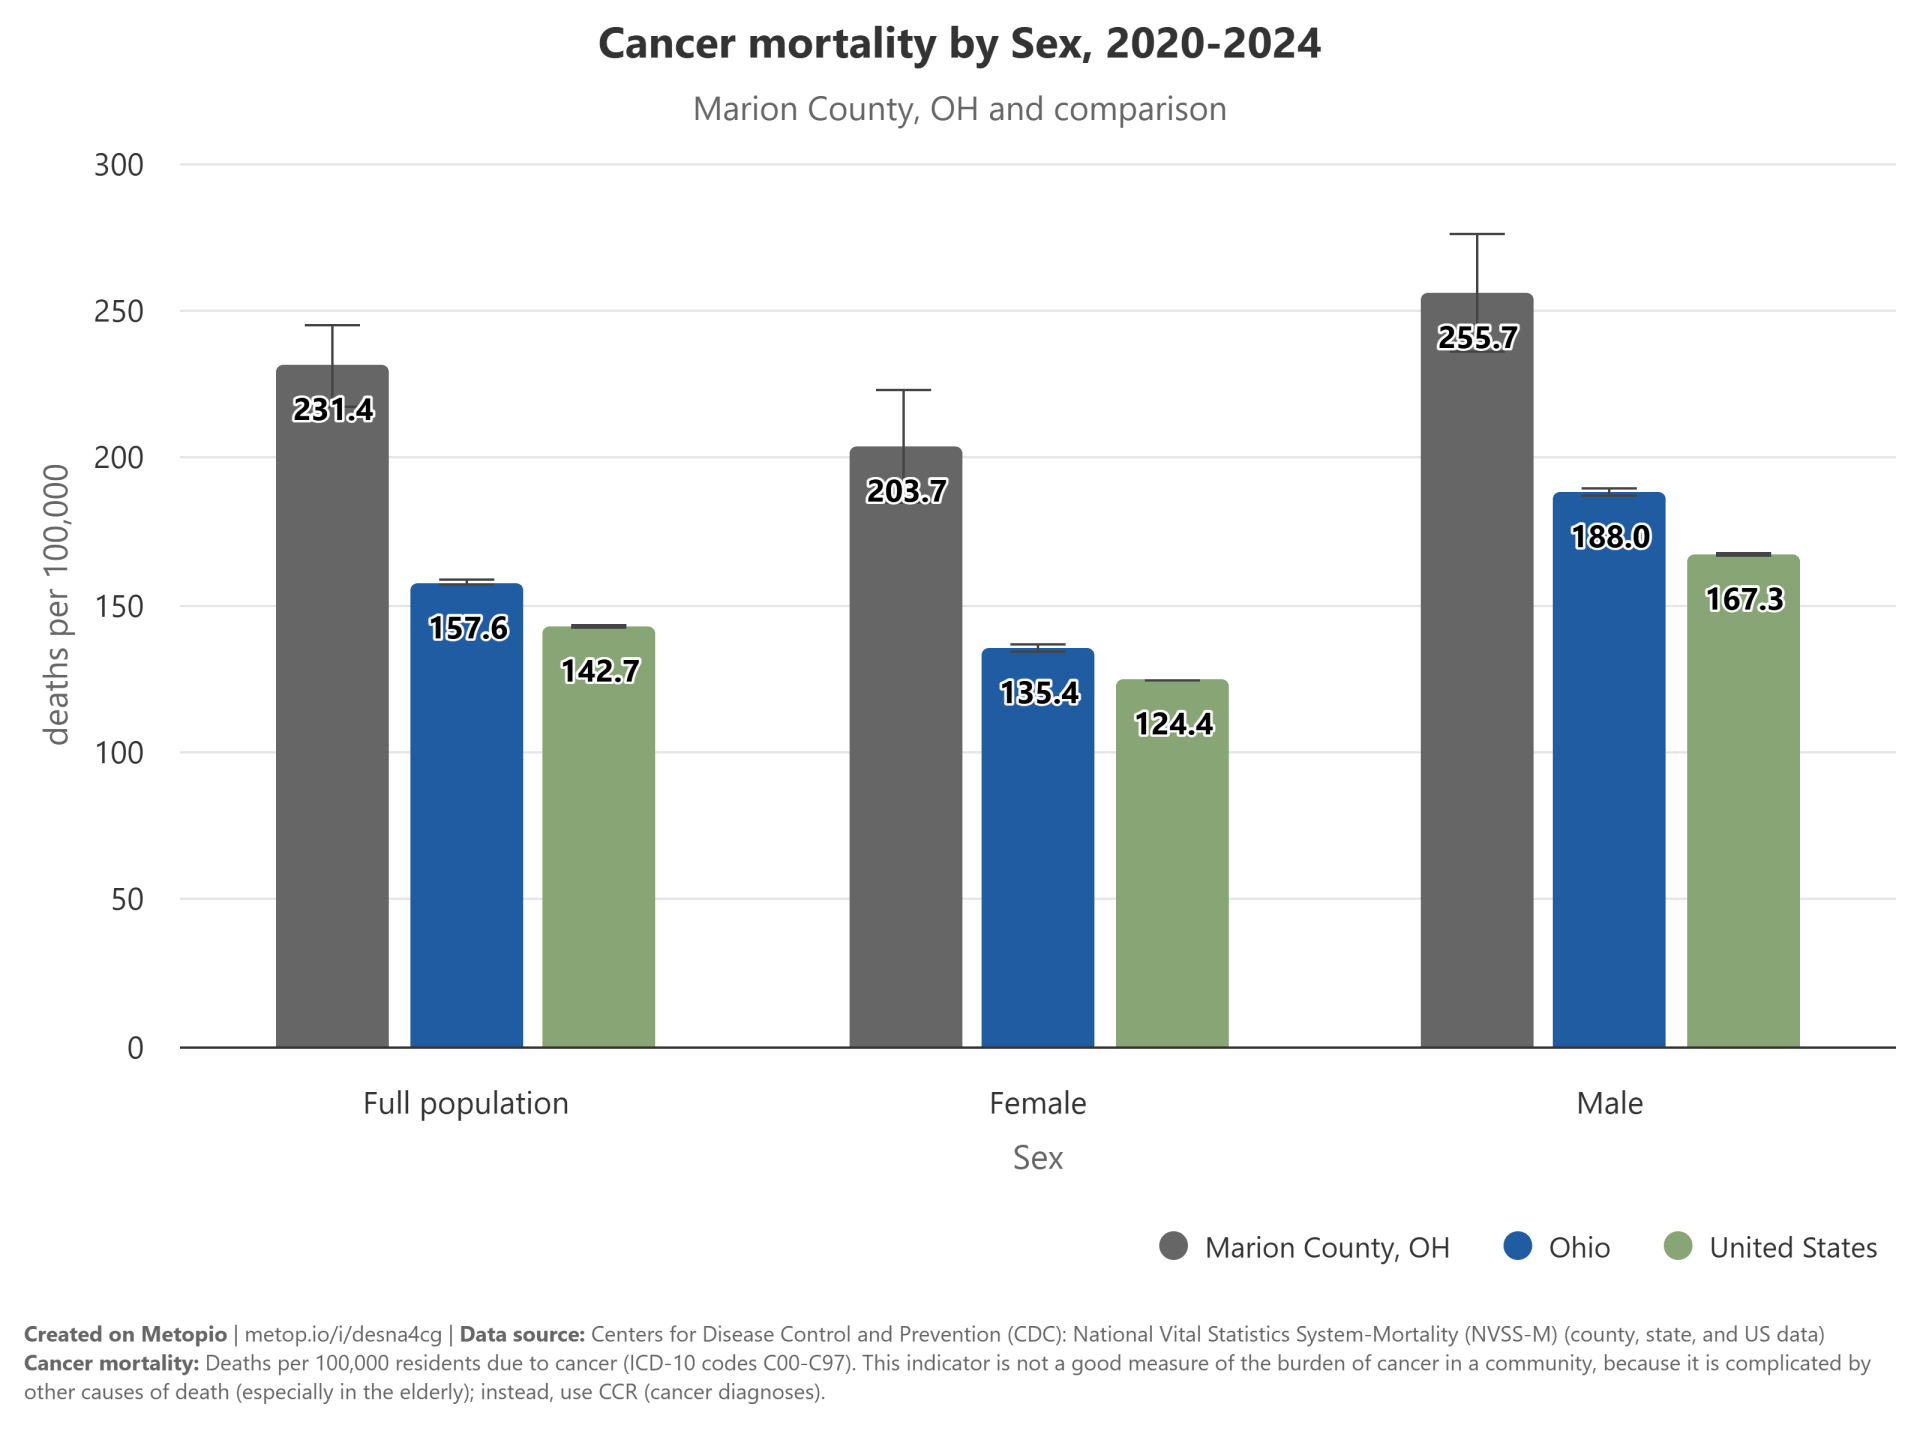
Cancer
Cancer mortality rates in Marion County, OH are higher than both the state of Ohio and the United States overall. The rates for both males and females in Marion County exceed the national and state averages, indicating a significant health concern for the area.
Food Access
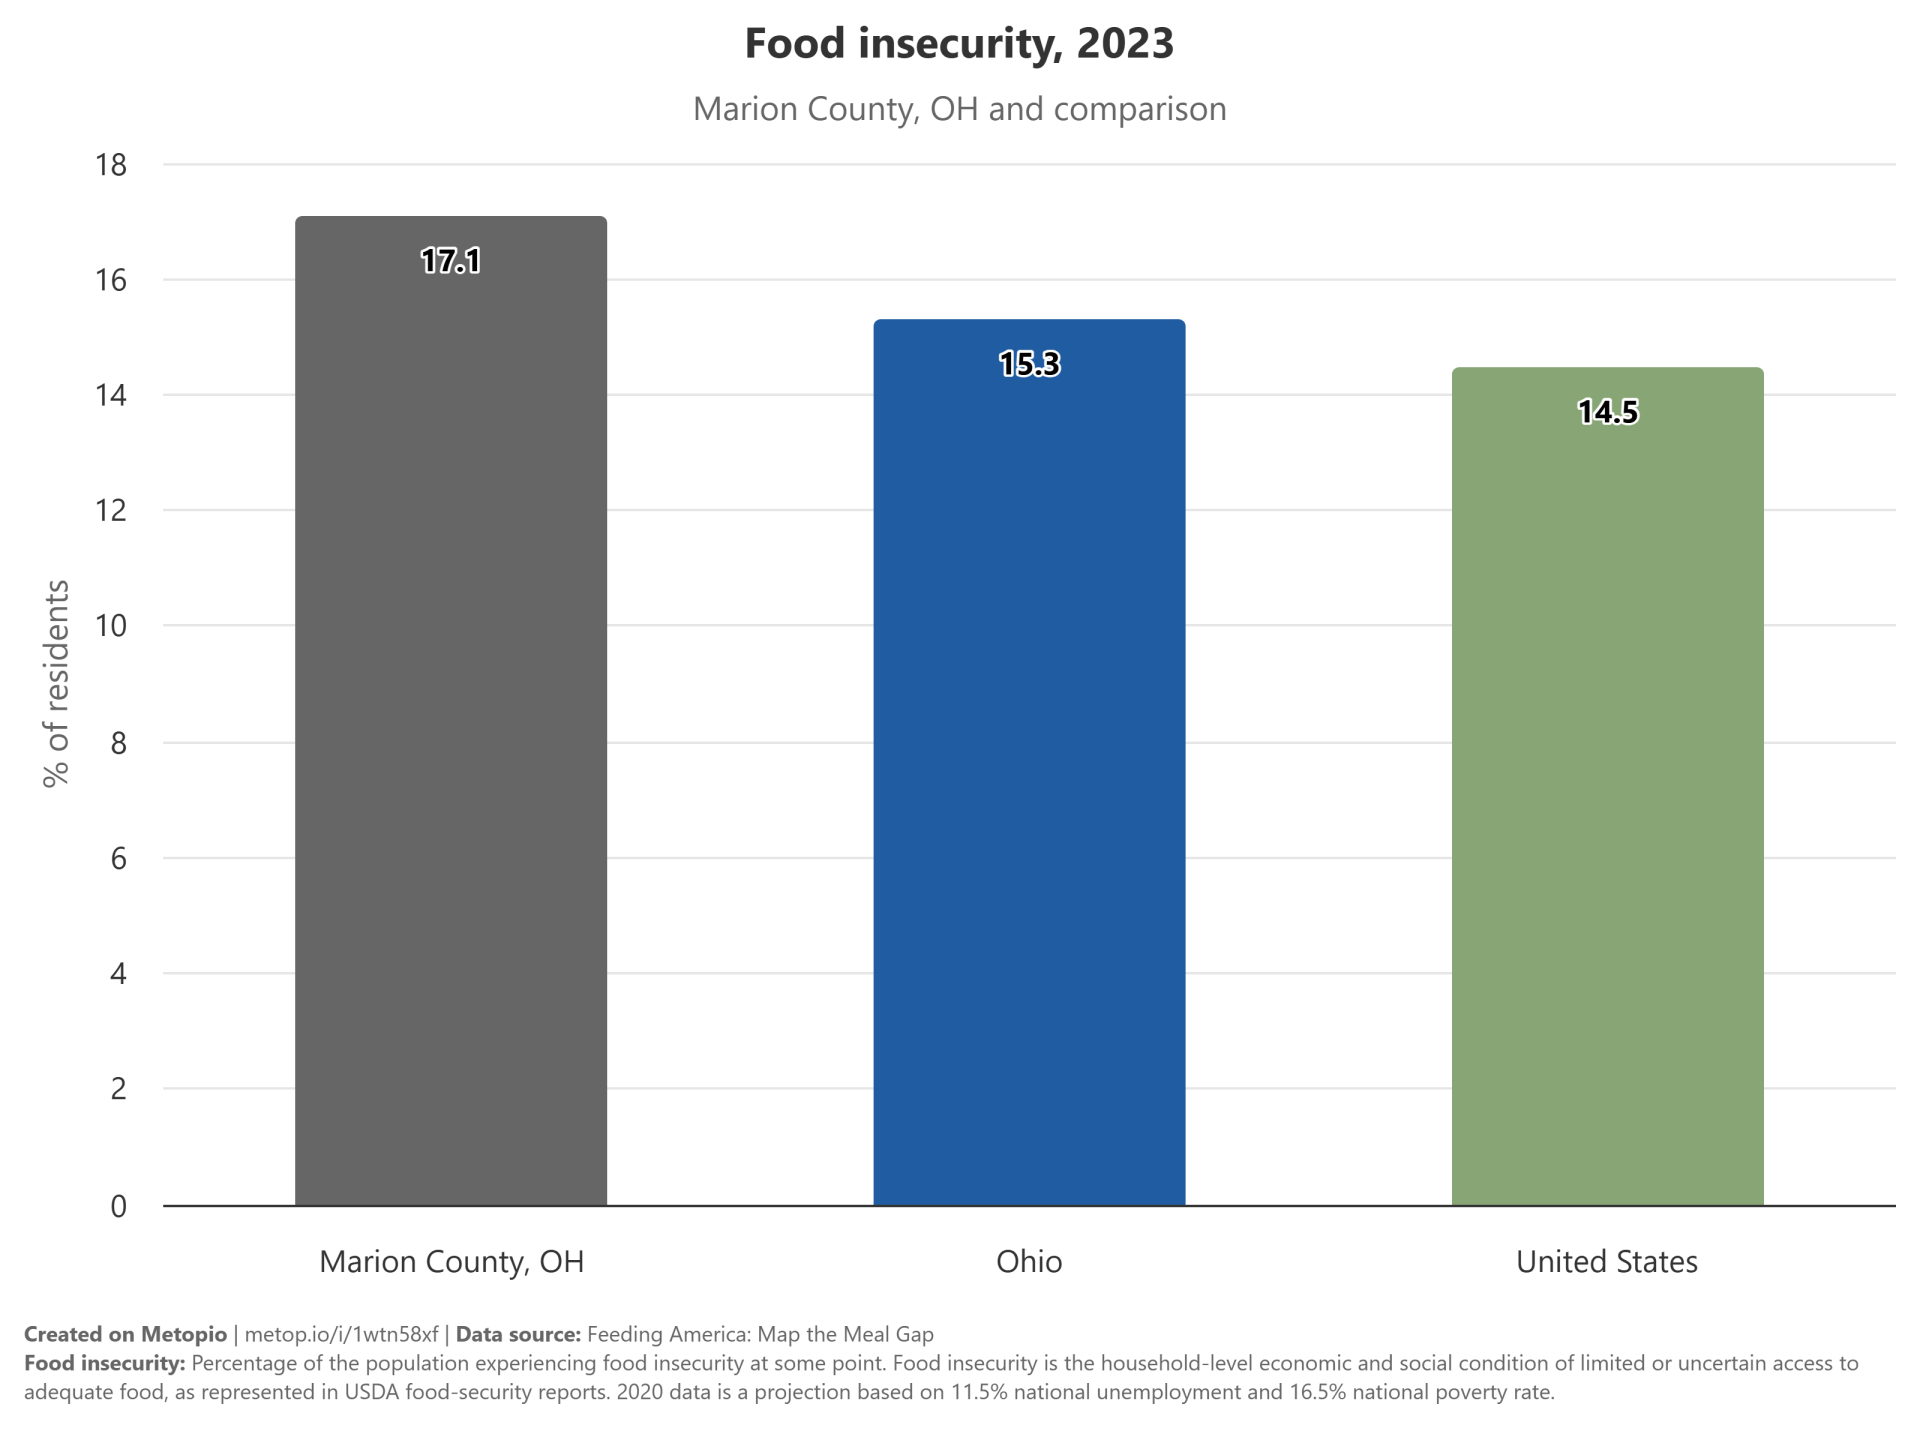
Food Insecurity
Food insecurity rates in Marion County, OH are higher than both the state and national averages. In Marion County, 17.1% of the population experiences food insecurity, compared to 15.3% in Ohio and 14.5% across the United States. This indicates a notable disparity in food security levels within the county. Addressing this issue could significantly improve the well-being of Marion County residents.
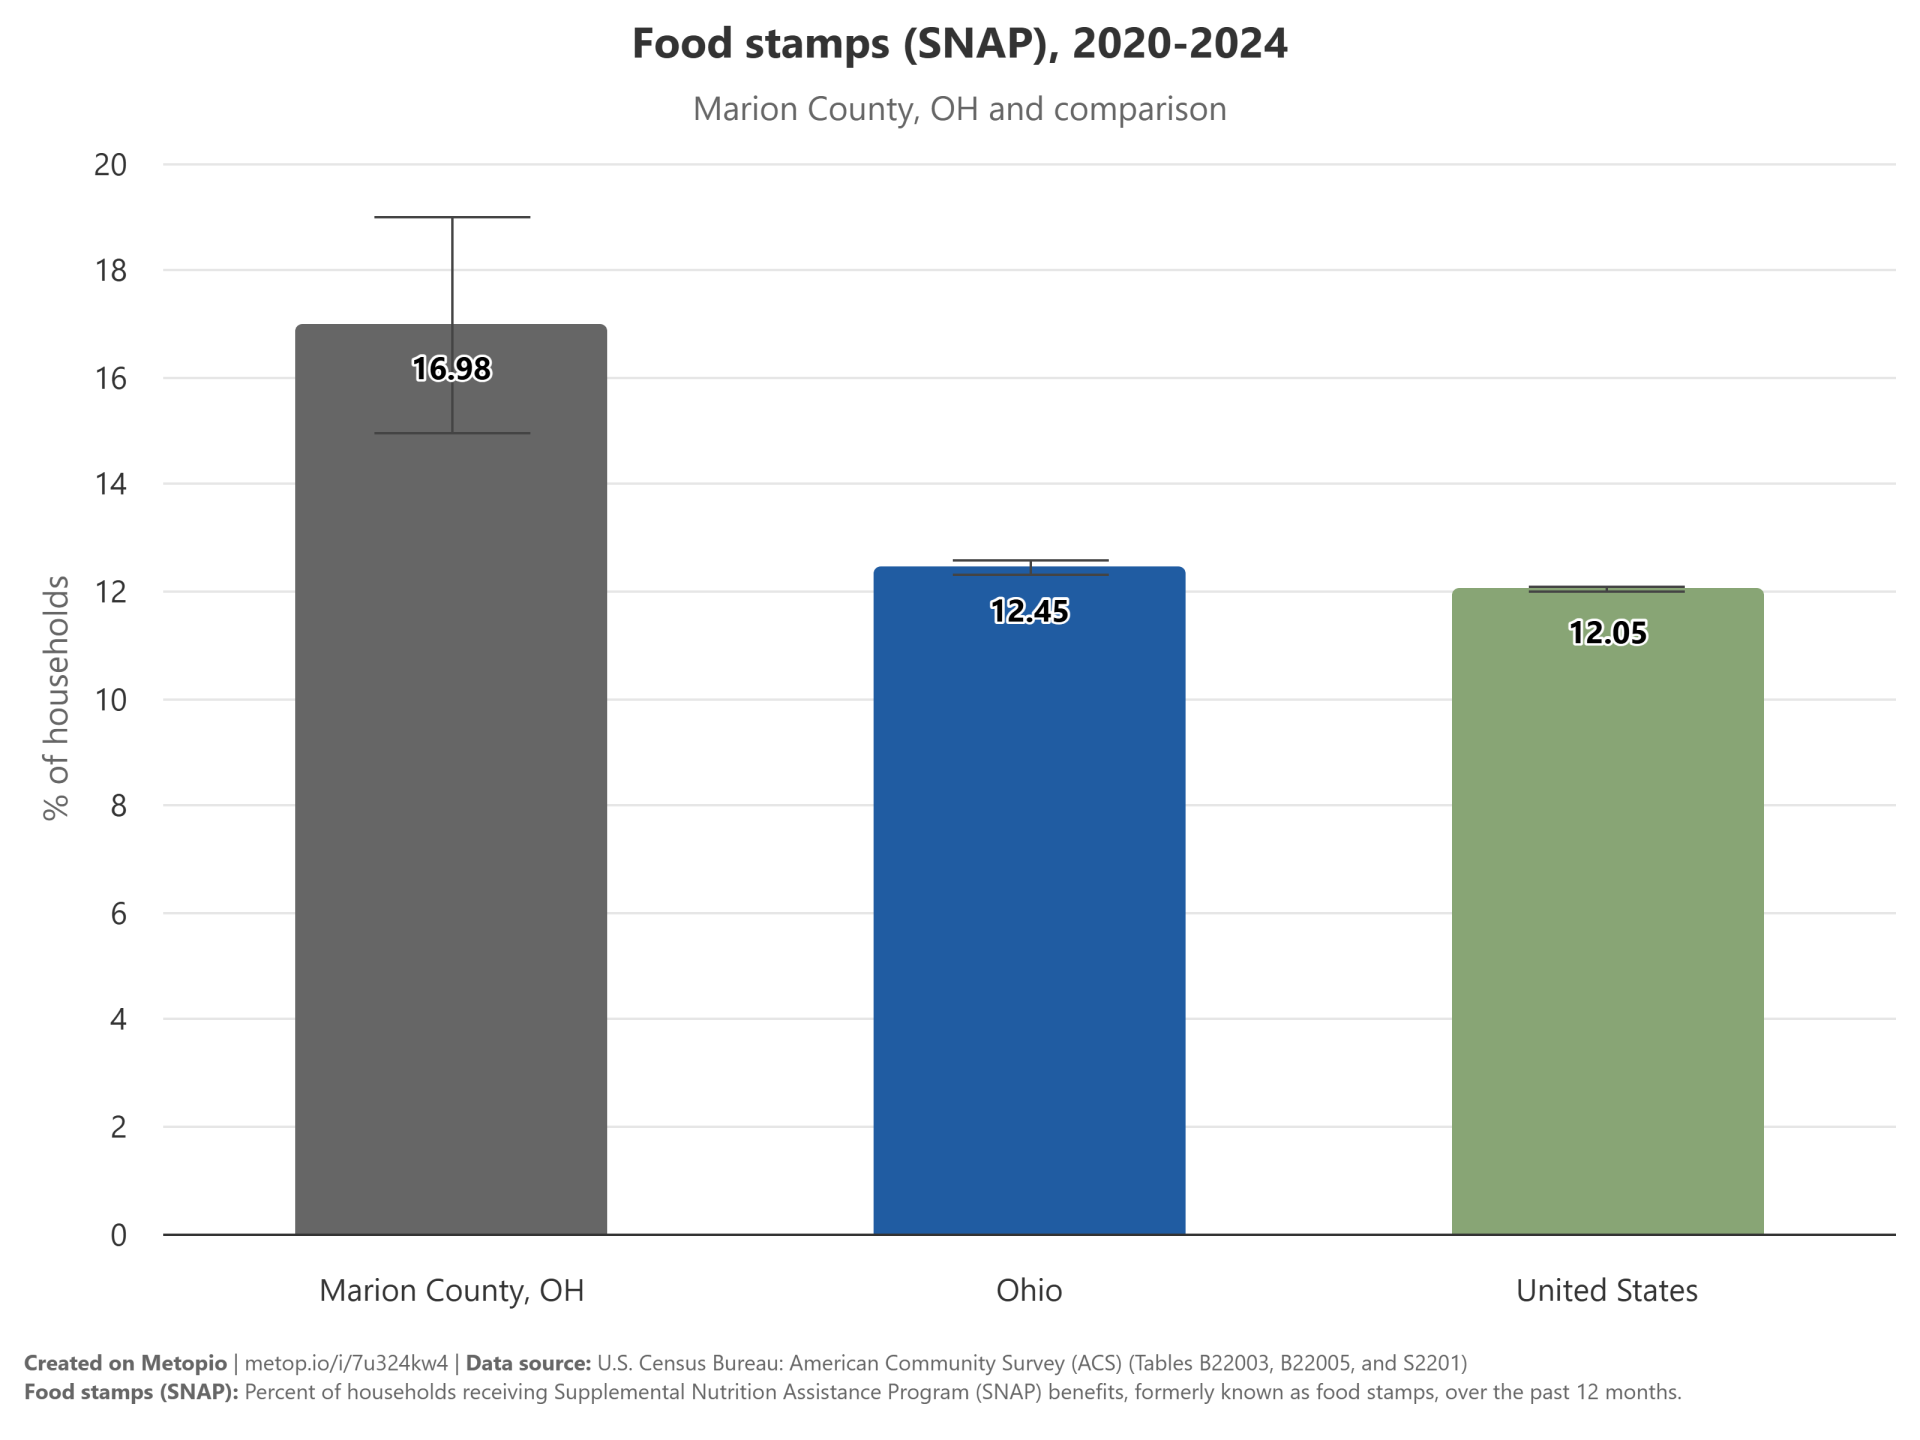
Food Stamps (SNAP)
Food stamps (SNAP) usage varies across different locations, with Marion County, OH having the highest rate at 16.98%, followed by the state of Ohio at 12.45%, and the United States overall at 12.05%. This indicates that Marion County has a notably higher rate of SNAP usage compared to the state and national averages.
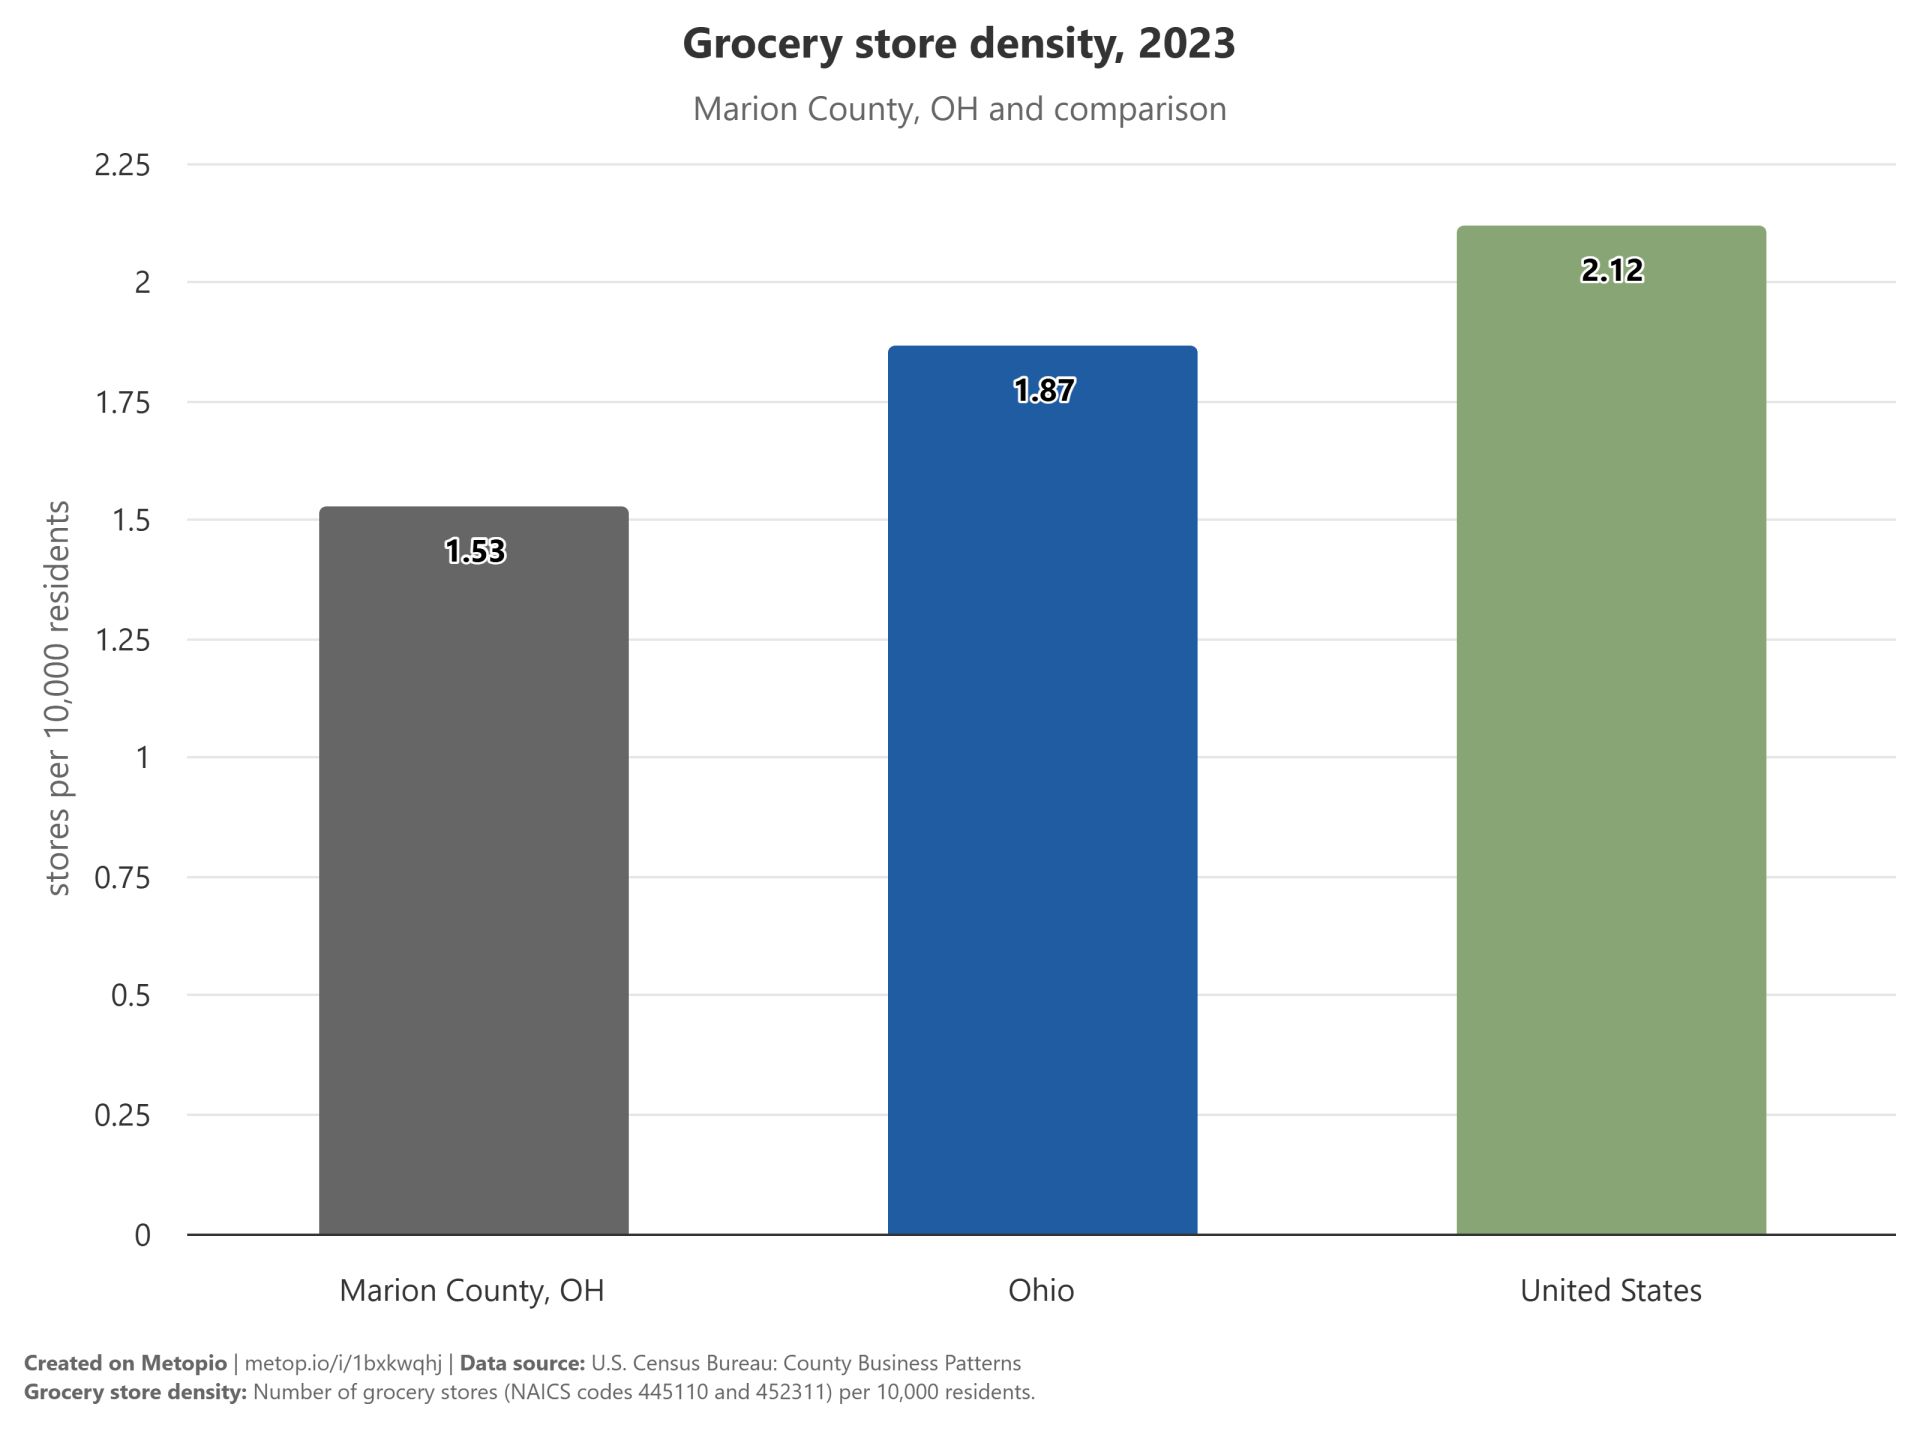
Grocery Stores
Grocery store density in the United States is 2.12 stores per 10,000 people. Ohio has a slightly lower density at 1.87 stores per 10,000 people. Marion County, OH, has the lowest density among the provided data points, with 1.53 stores per 10,000 people. This indicates a notable difference in grocery store accessibility across different regions.
Housing
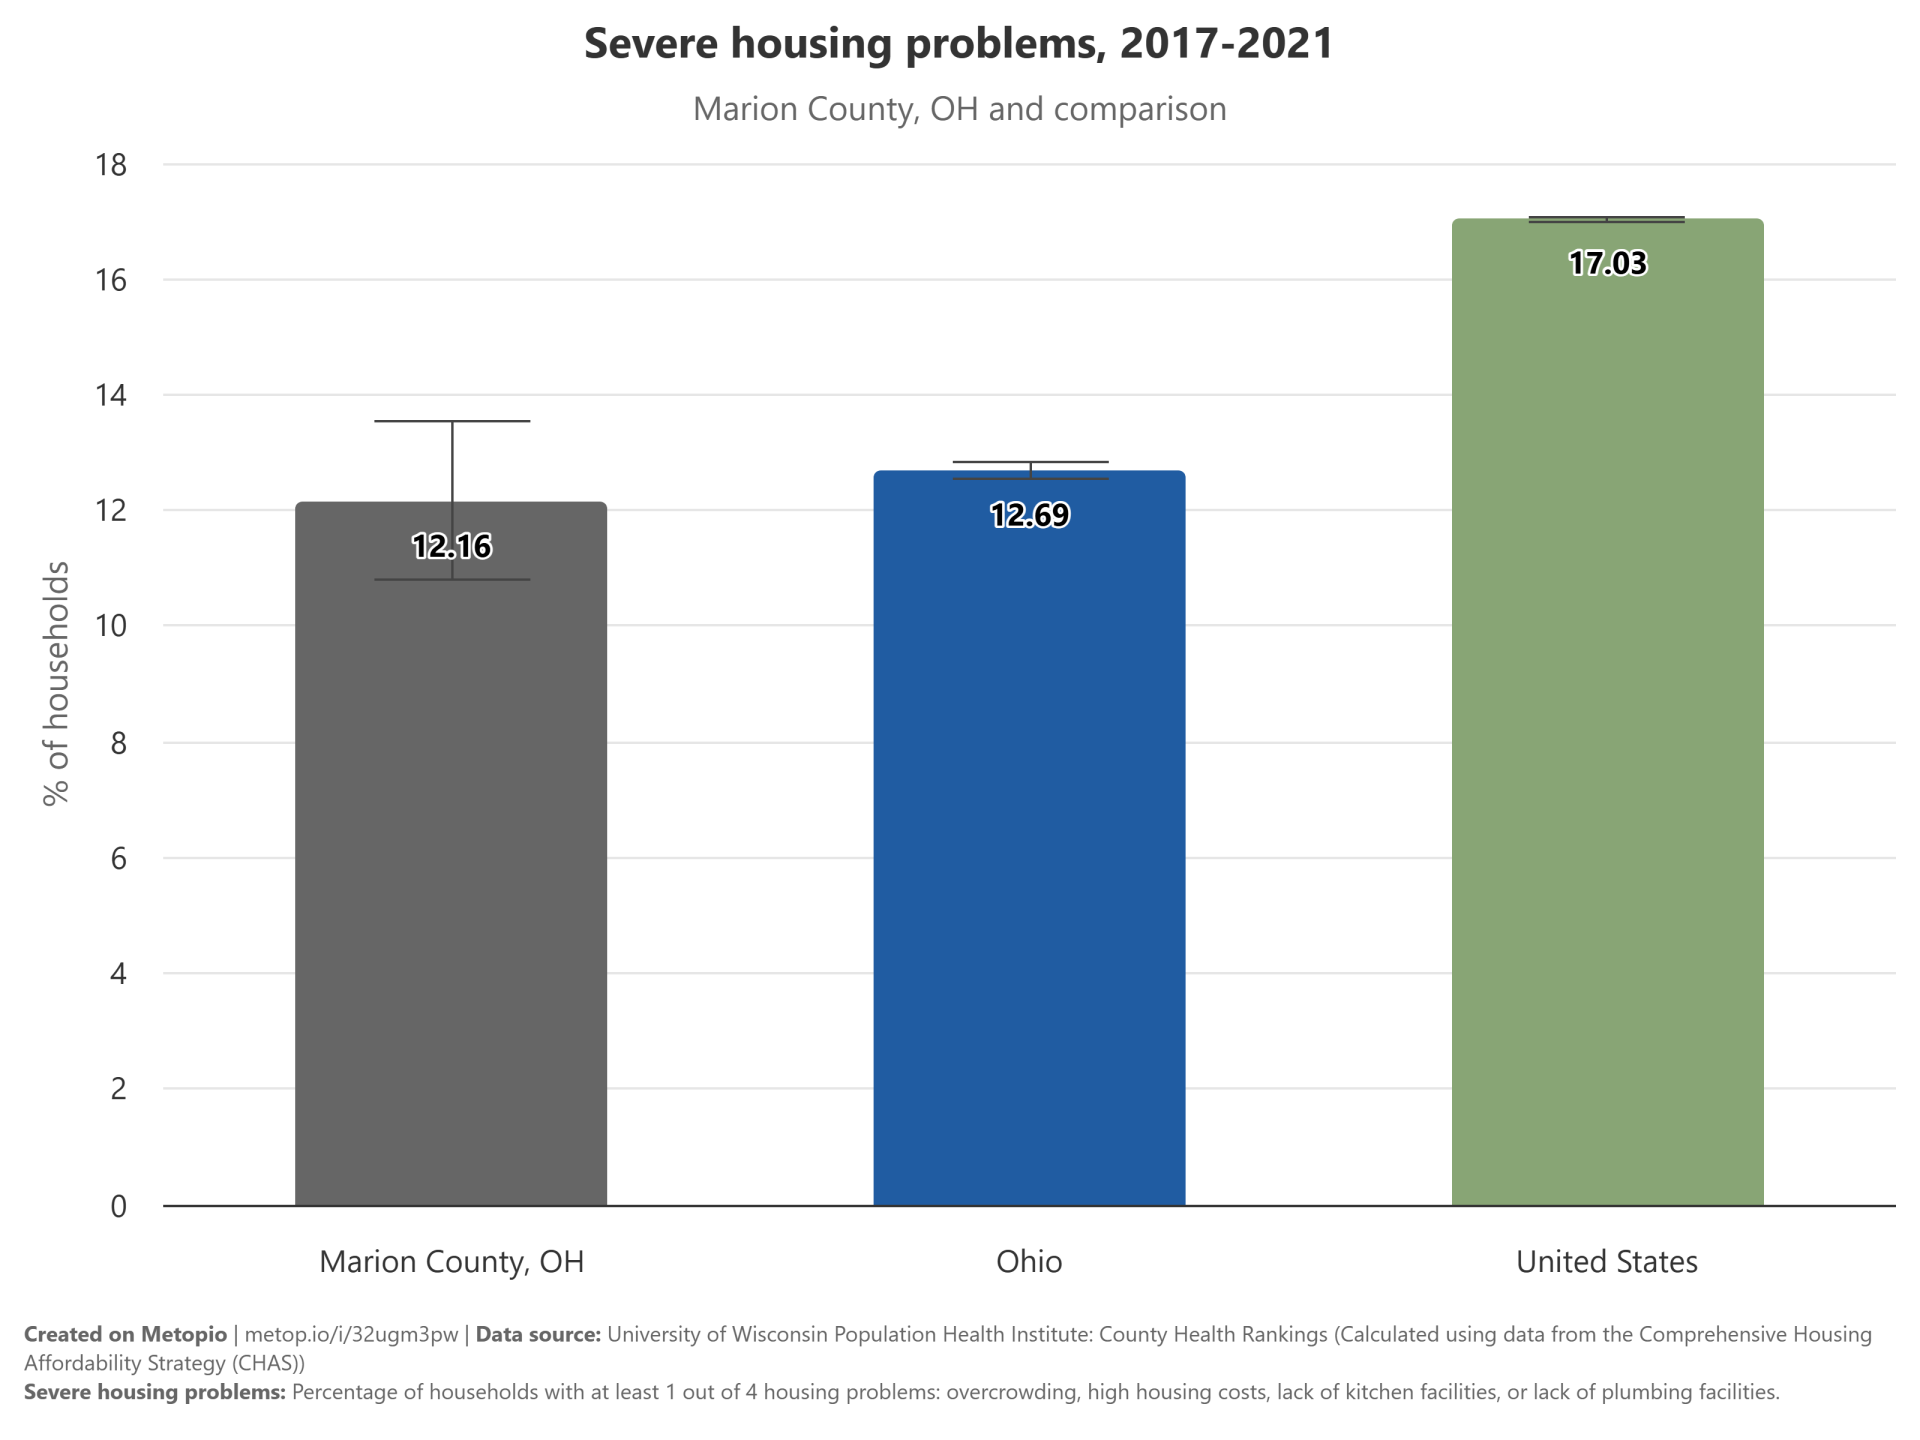
Severe Housing Problems
Severe housing problems are a significant issue across the United States, with a national rate of 17.03%. Ohio faces a lower rate at 12.69%, and Marion County, OH, reports an even lower rate of 12.16%. This indicates a general trend of decreasing severity of housing problems at more localized levels.
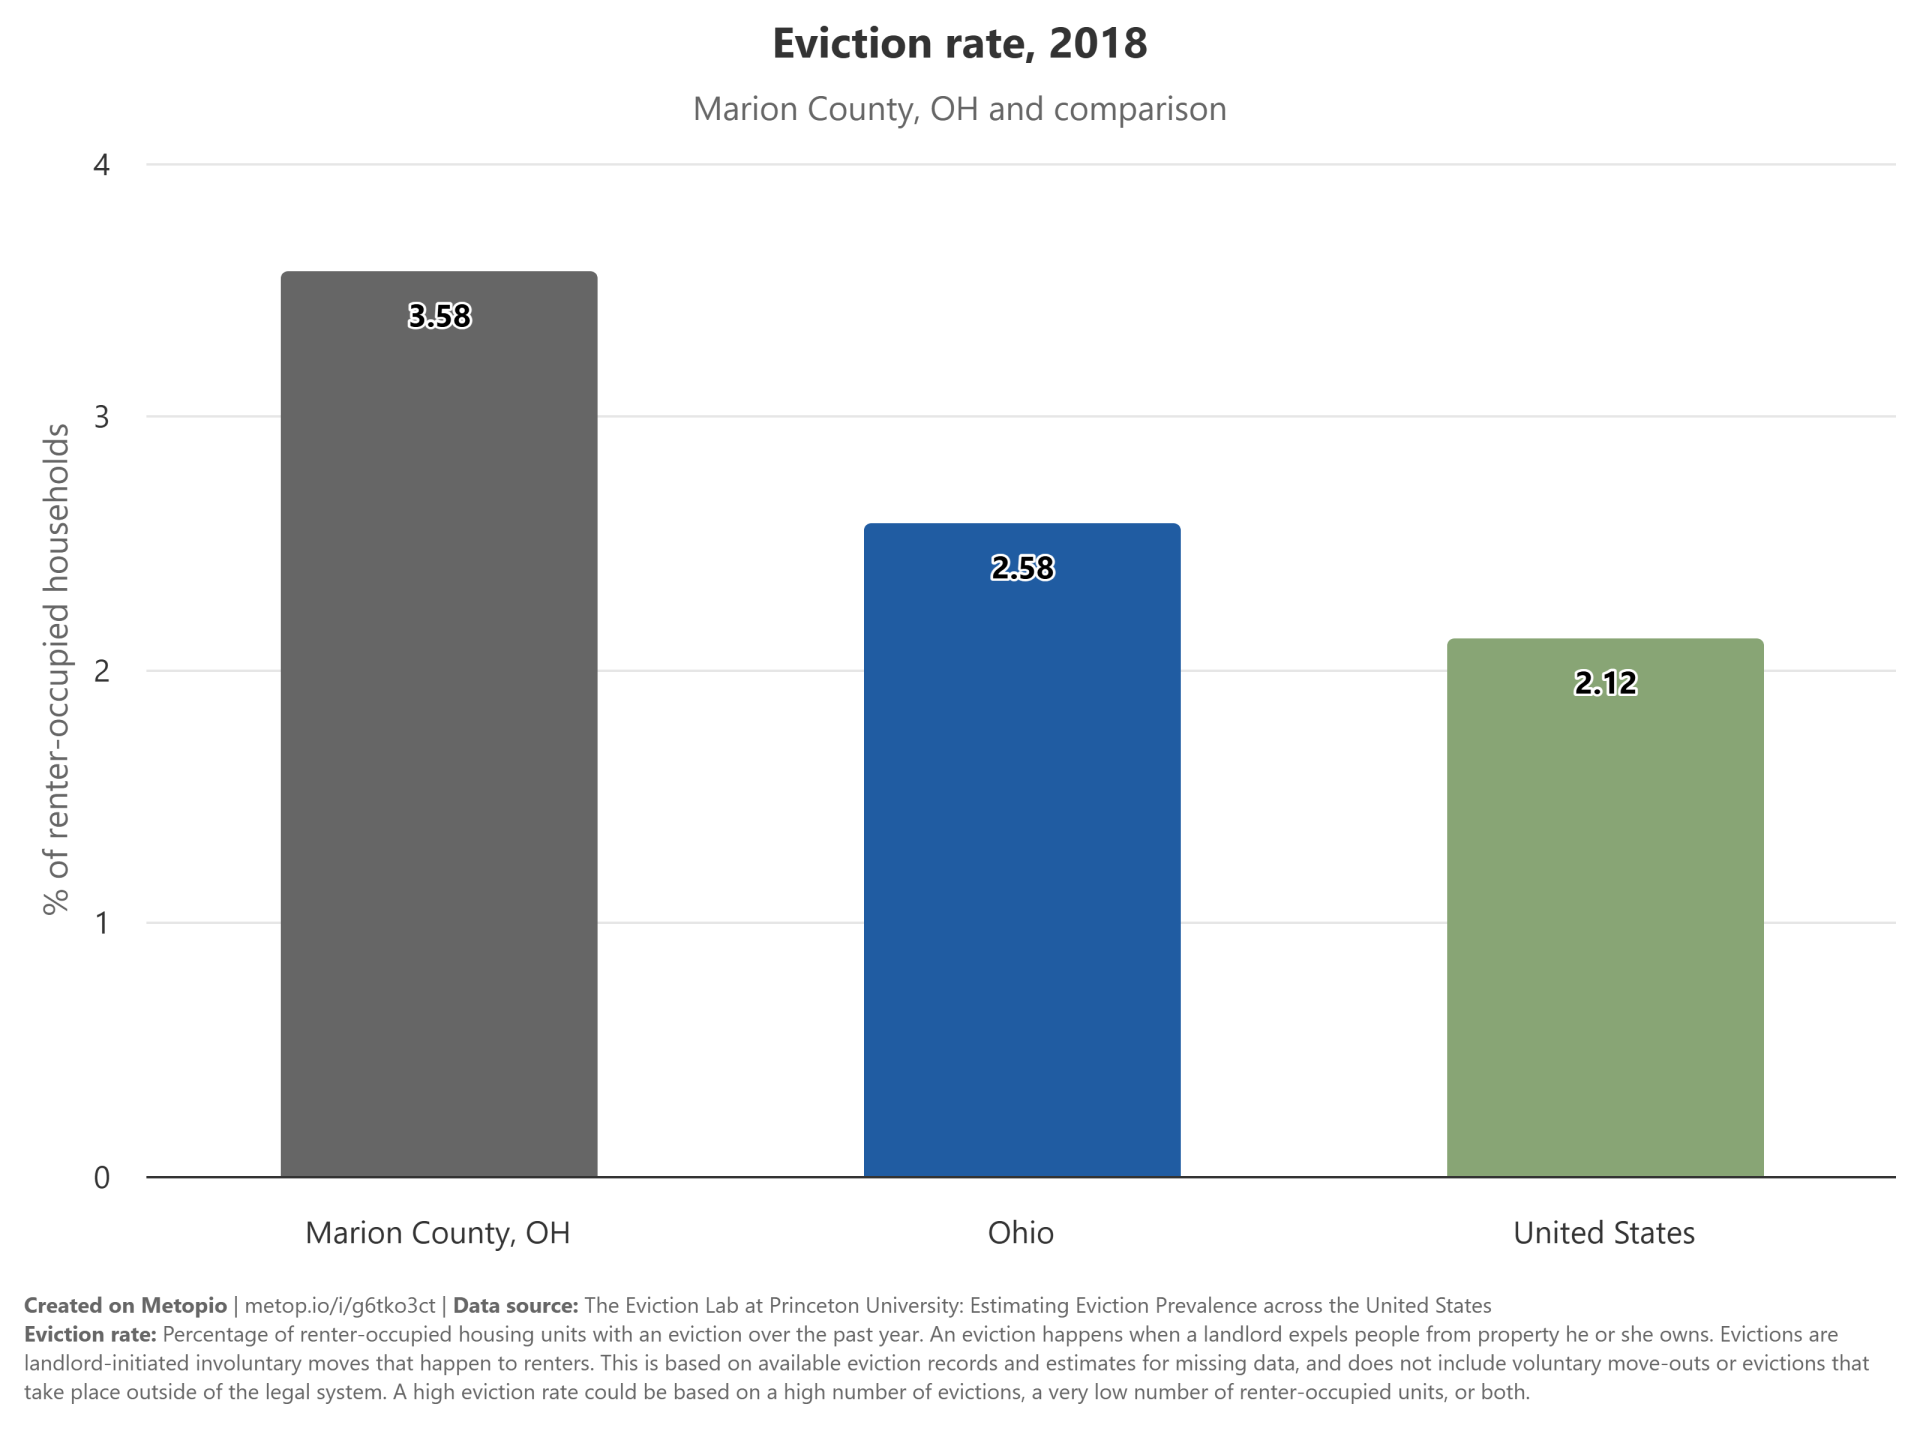
Eviction Rate
The eviction rate in Marion County, OH is notably higher than the state and national averages. Ohio’s eviction rate is slightly above the national average, indicating a more pronounced issue within the state. This suggests that Marion County faces a significant challenge with evictions compared to both state and national levels.
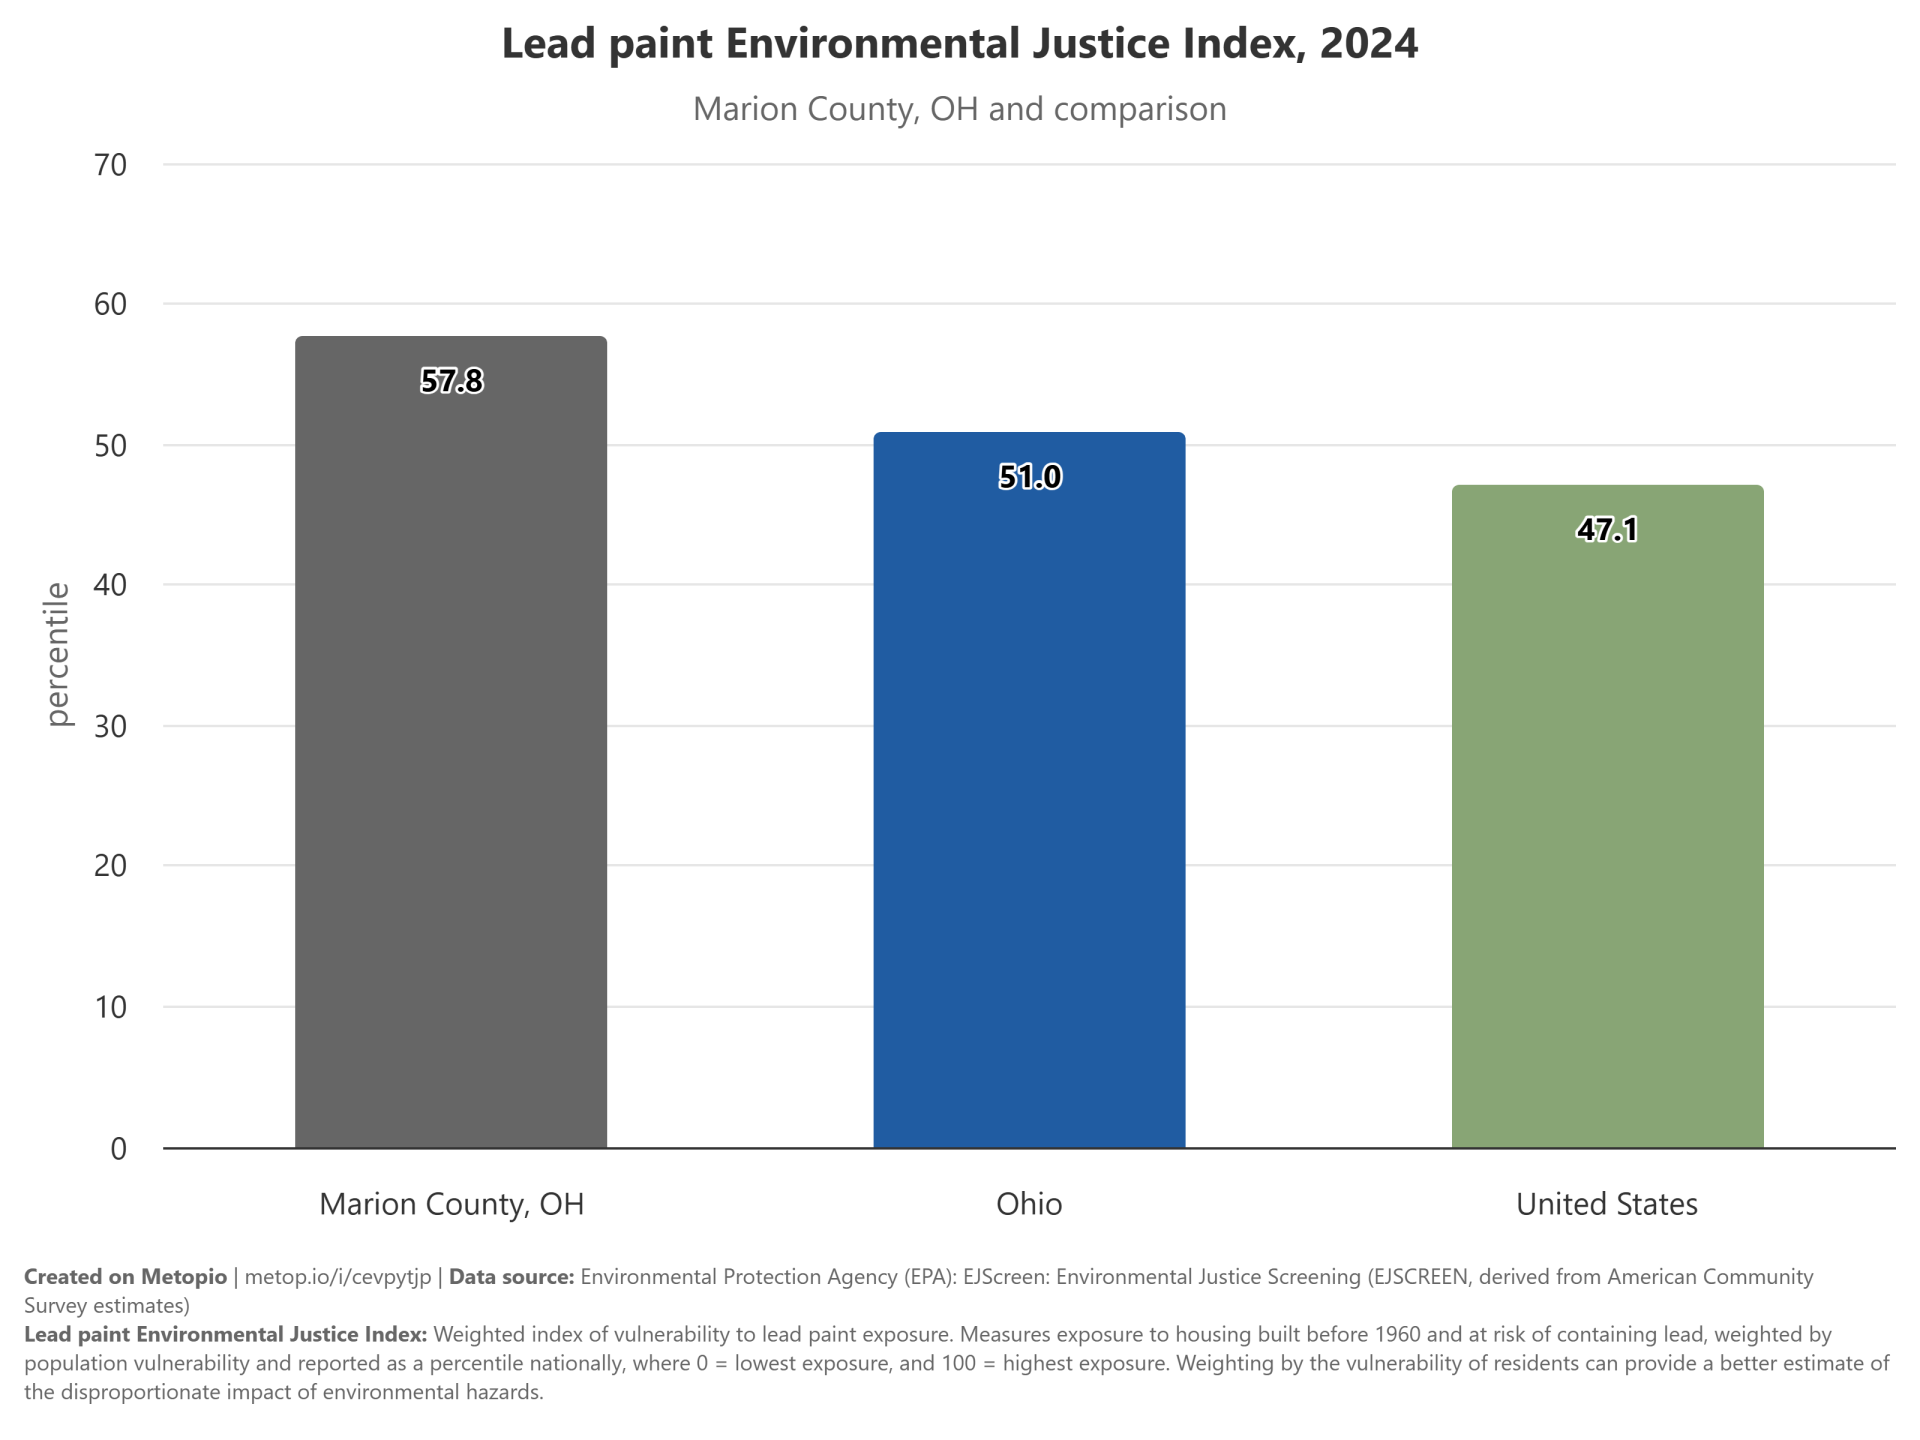
Lead Paint
The data indicates that Marion County, Ohio, has a higher Lead Paint Environmental Justice Index than both the state of Ohio and the United States as a whole. Marion County’s index is 57.8, while Ohio’s is 51.0, and the national index is 47.1. This suggests that Marion County may face greater environmental justice concerns related to lead paint compared to the broader state and national averages.
Overall Health
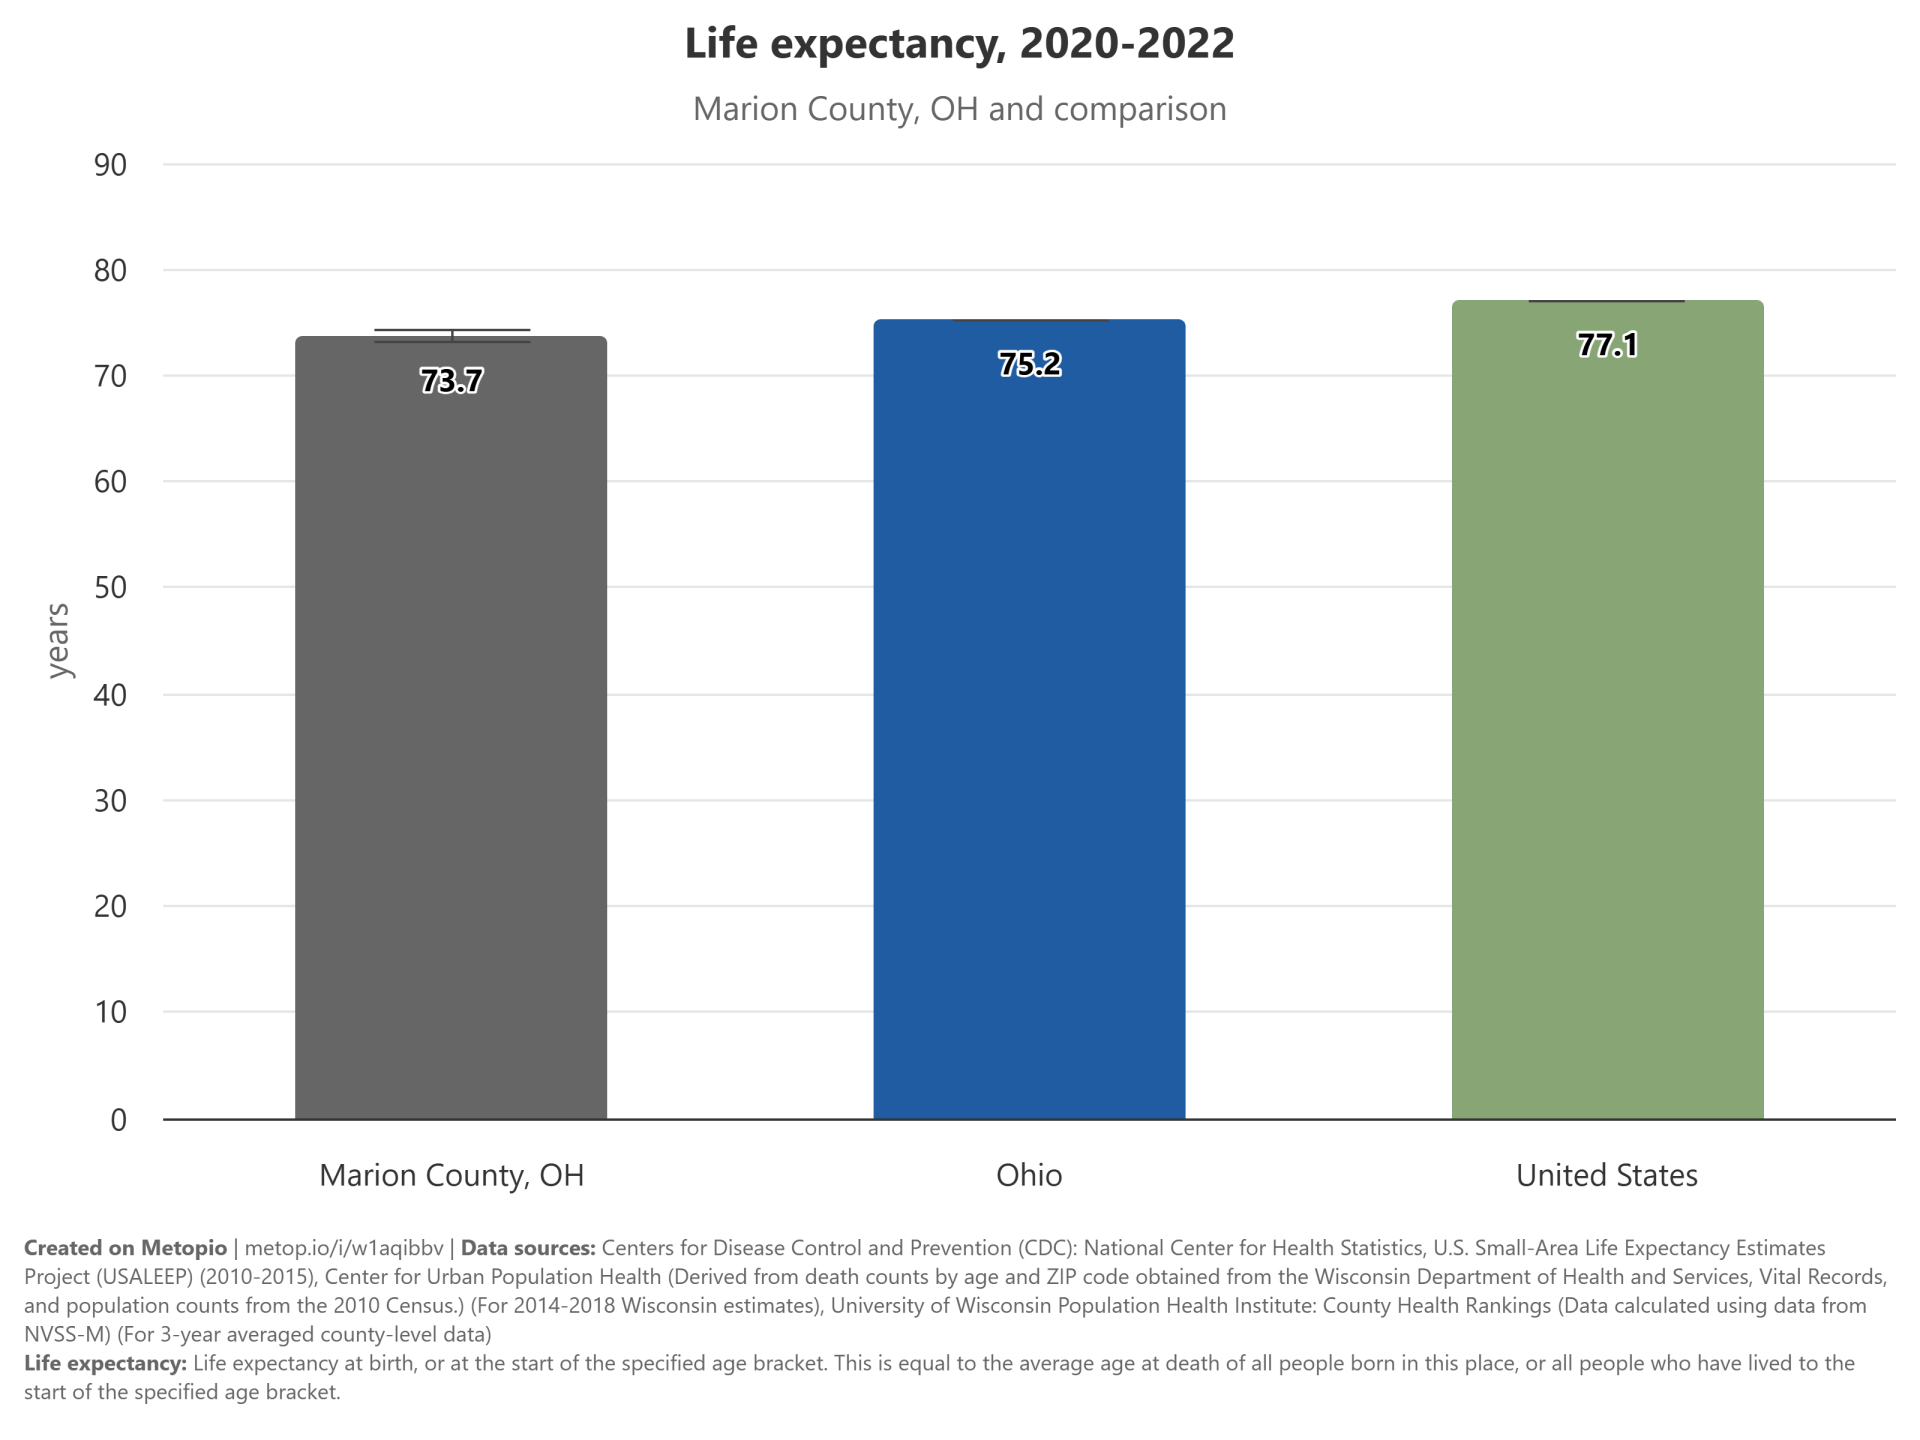
Life Expectancy
At 73.69 years, life expectancy in Marion County is lower than the national average, highlighting the impact of premature mortality.
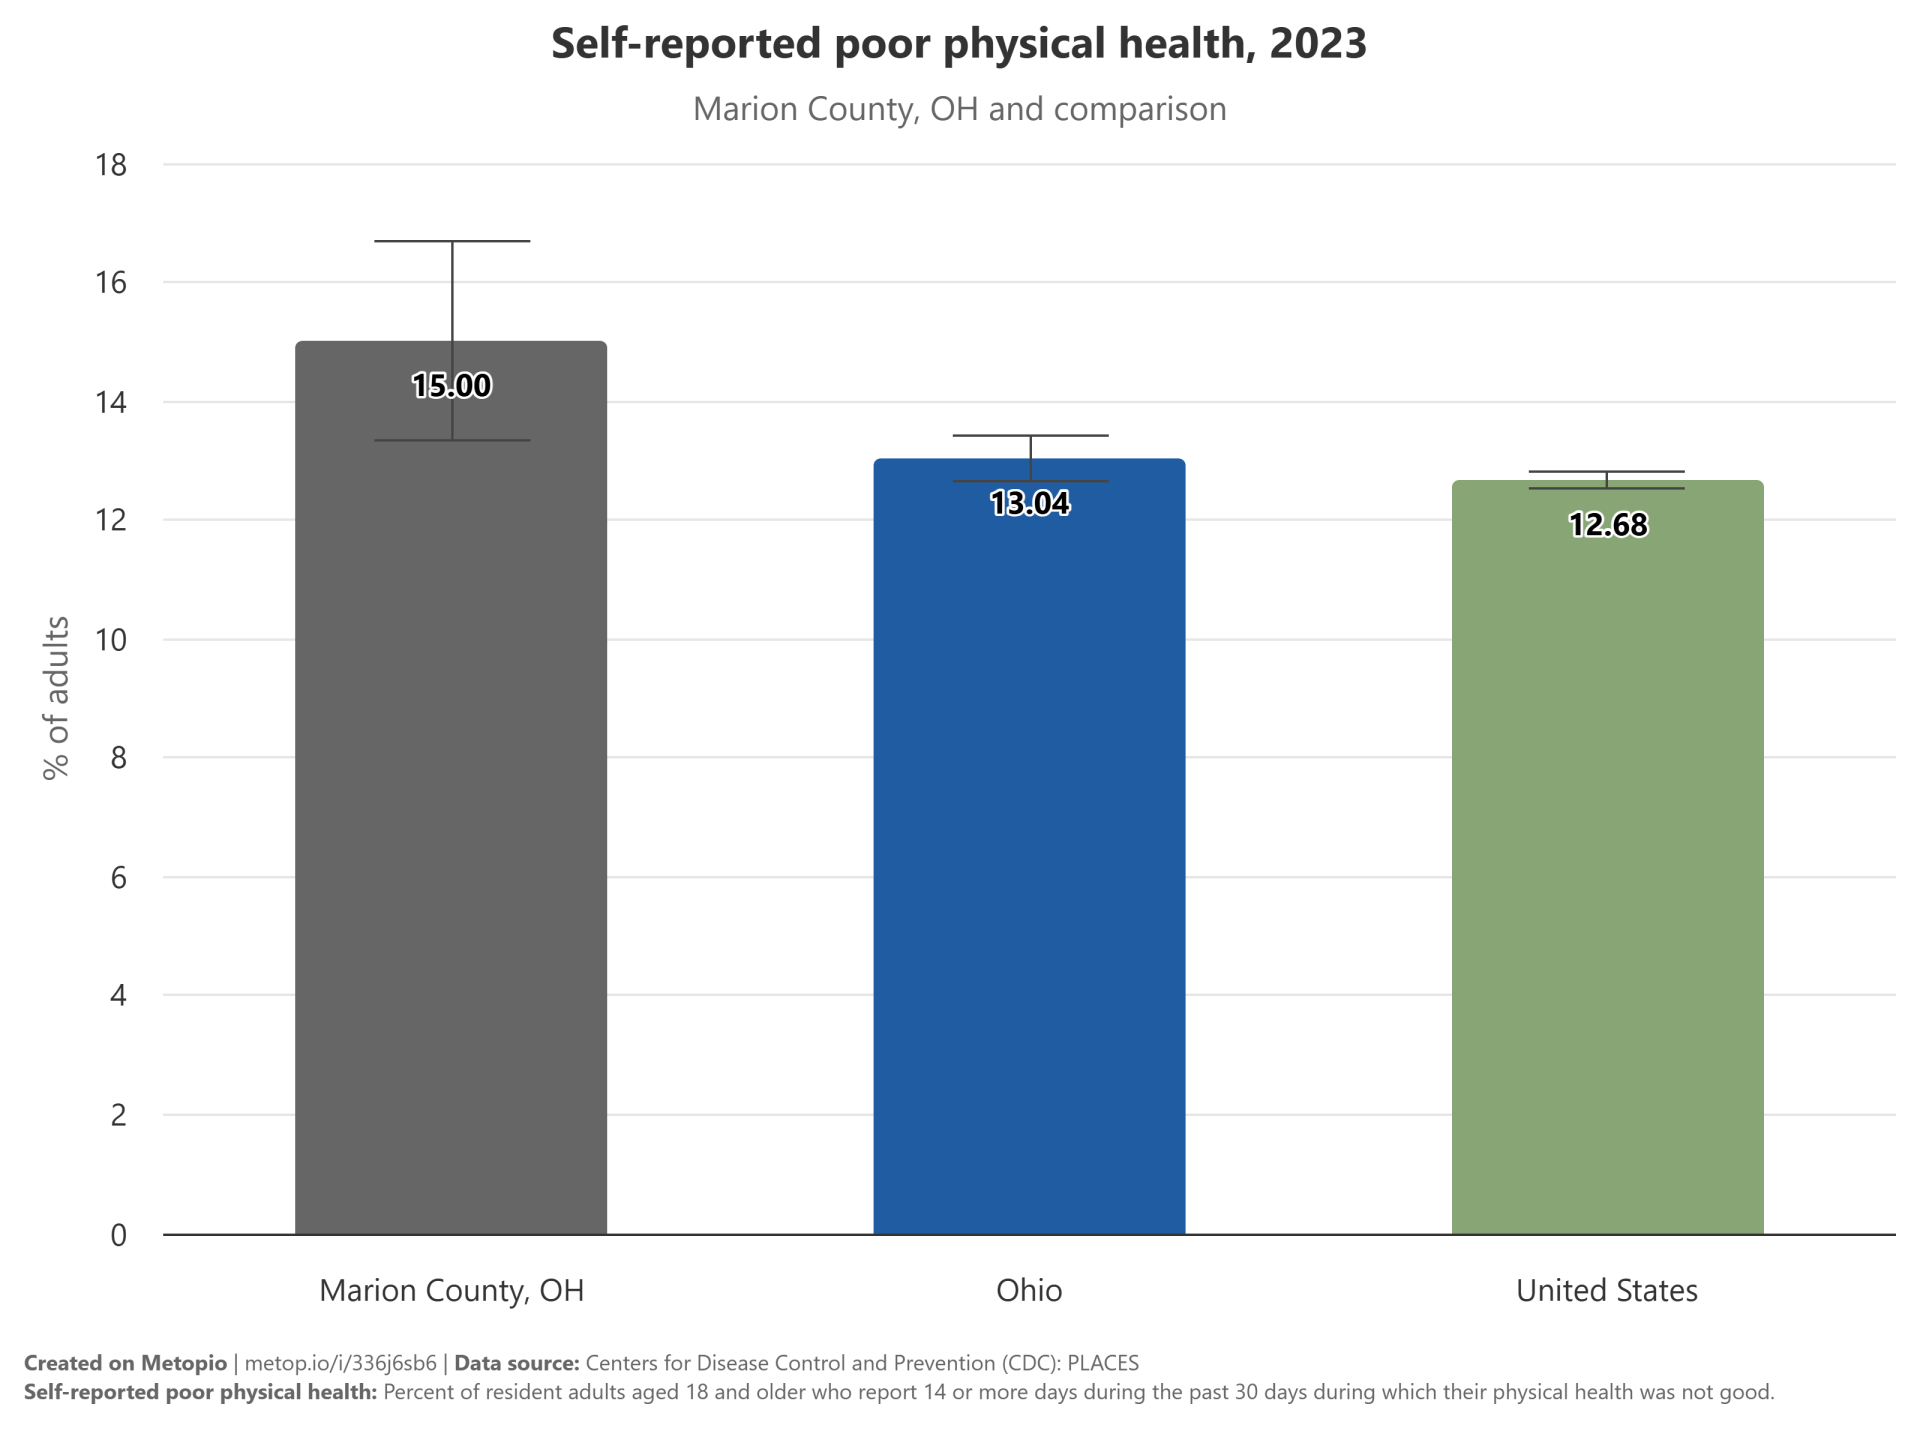
Self-Reported Poor Physical Health
A significant portion of adults report poor physical health, with 15% experiencing poor health in the past month. This is higher than the national average, suggesting a need for better health management and support.
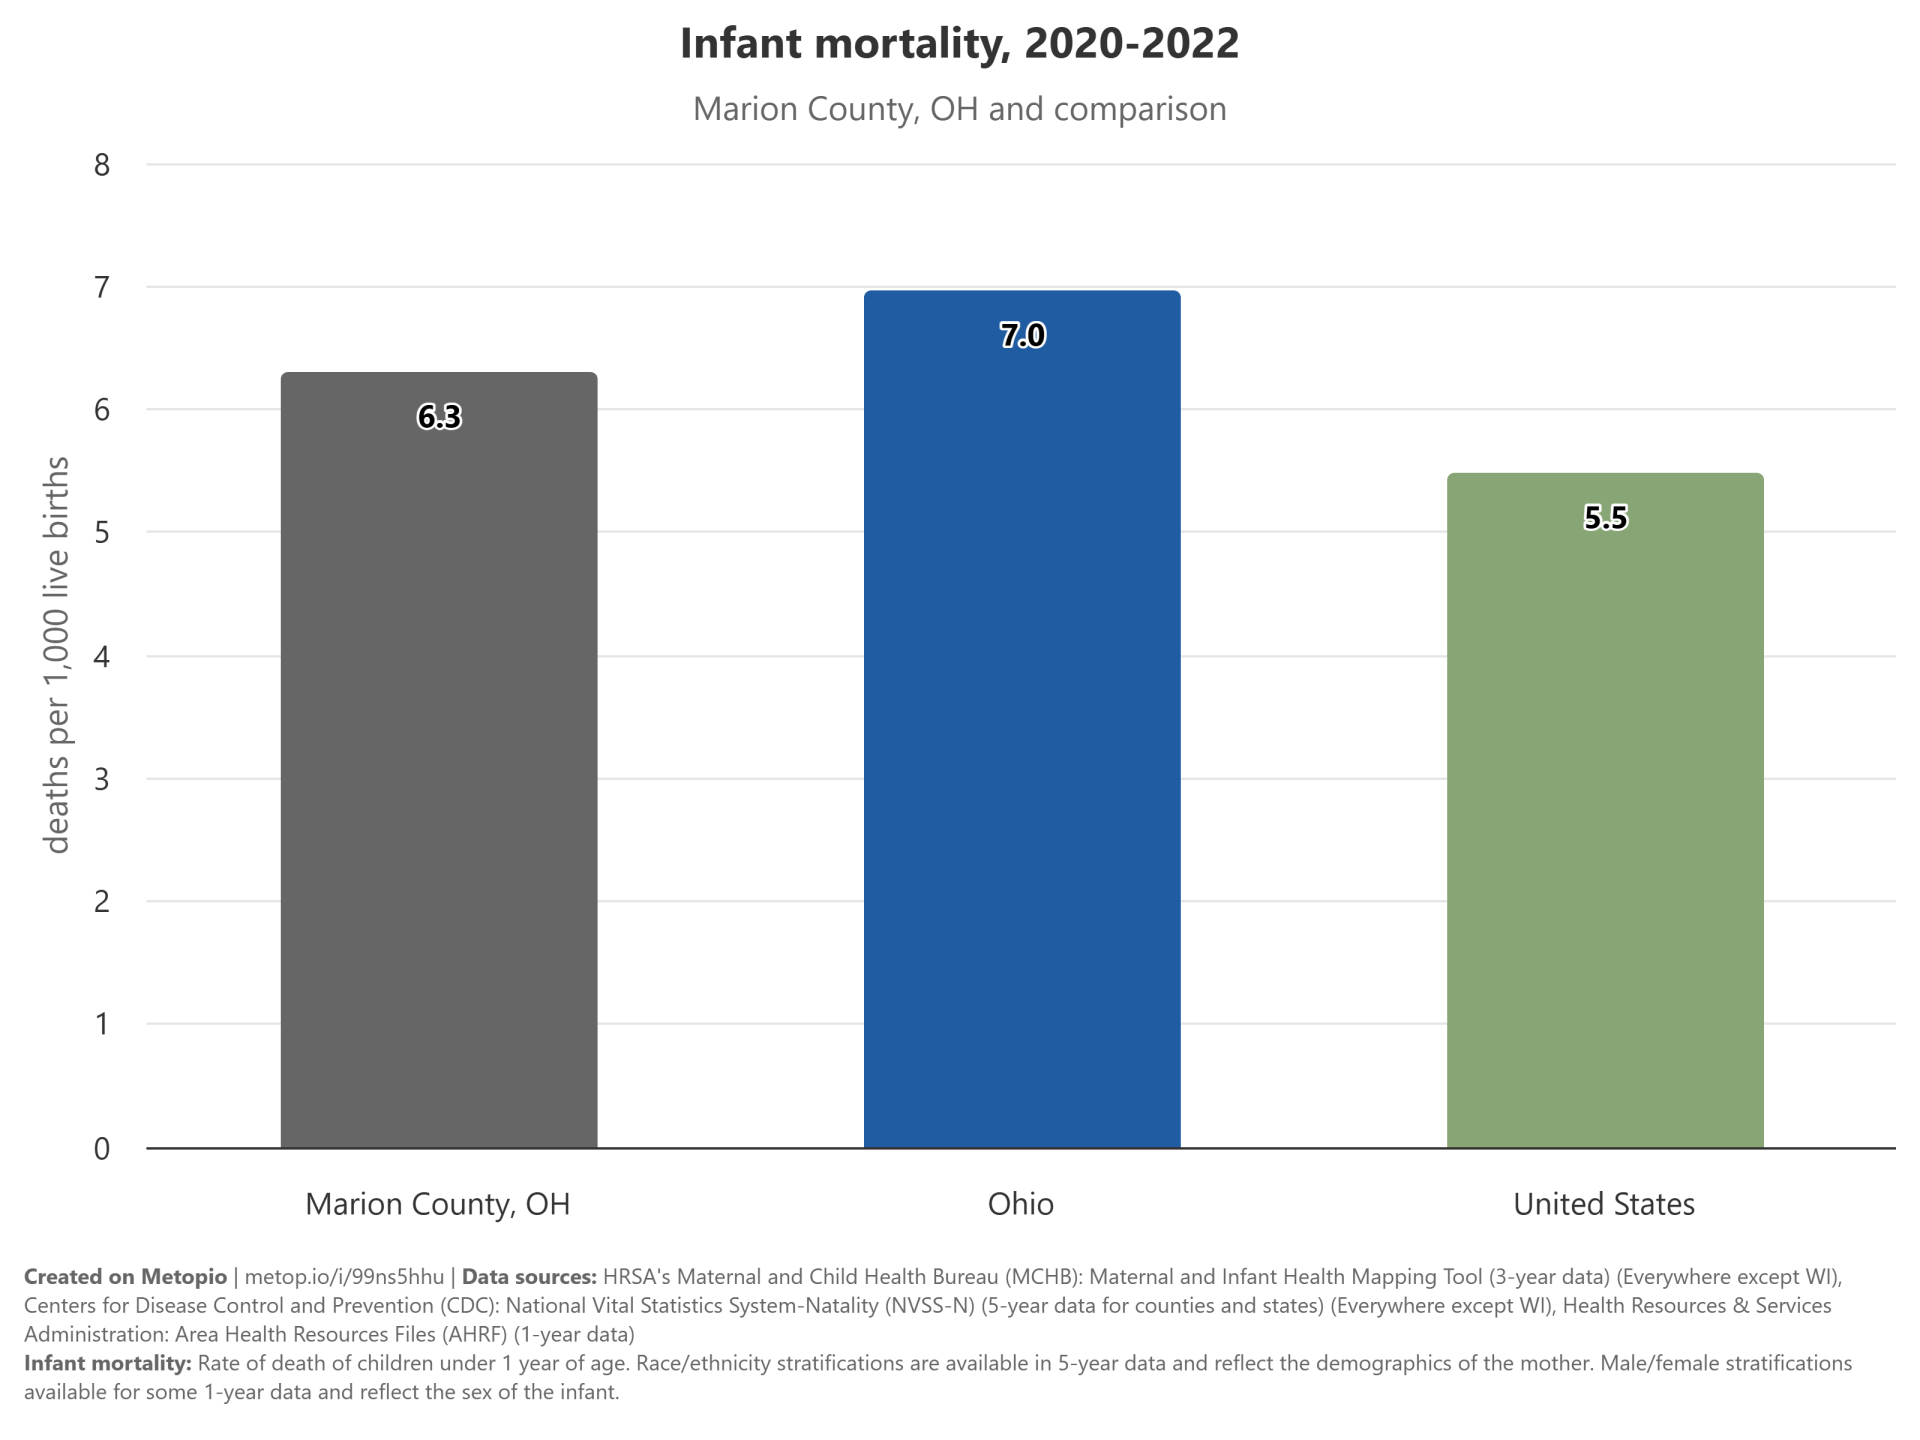
Infant Mortality
Infant mortality rates vary across different regions, with Ohio experiencing a rate of 7.0, slightly higher than the national average of 5.5. Marion County, OH, reports a lower rate of 6.3, indicating some regional disparities within the state. These differences highlight the need for targeted health interventions to address infant mortality.
Socio-economic Factors
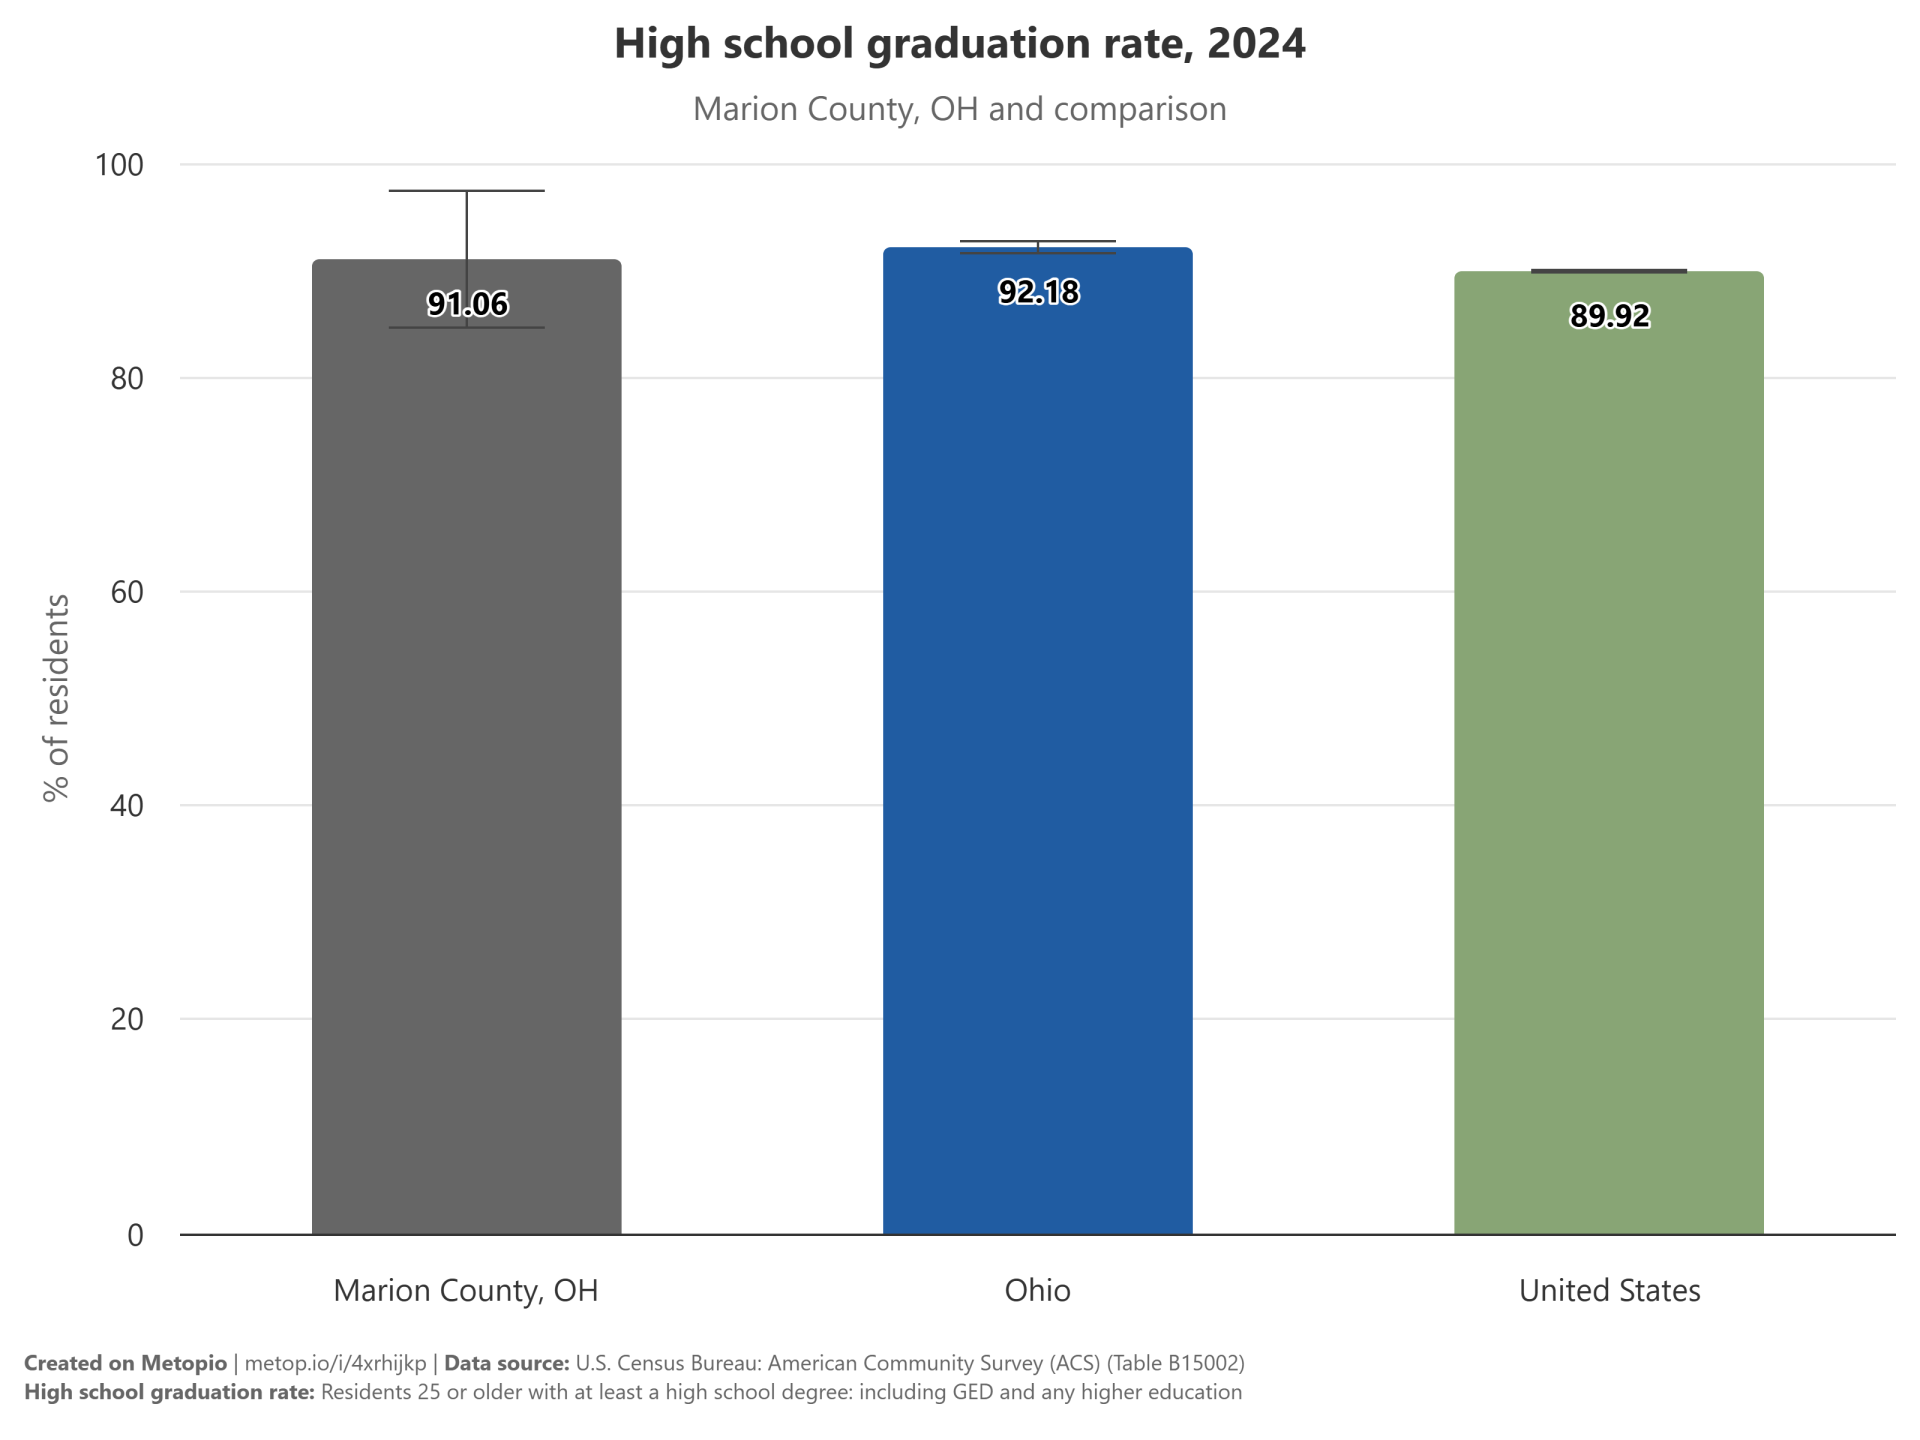
Education
The high school graduation rate in Ohio is 92.18%. Marion County, OH, has a slightly lower rate of 91.06%. The United States overall has a graduation rate of 89.92%.
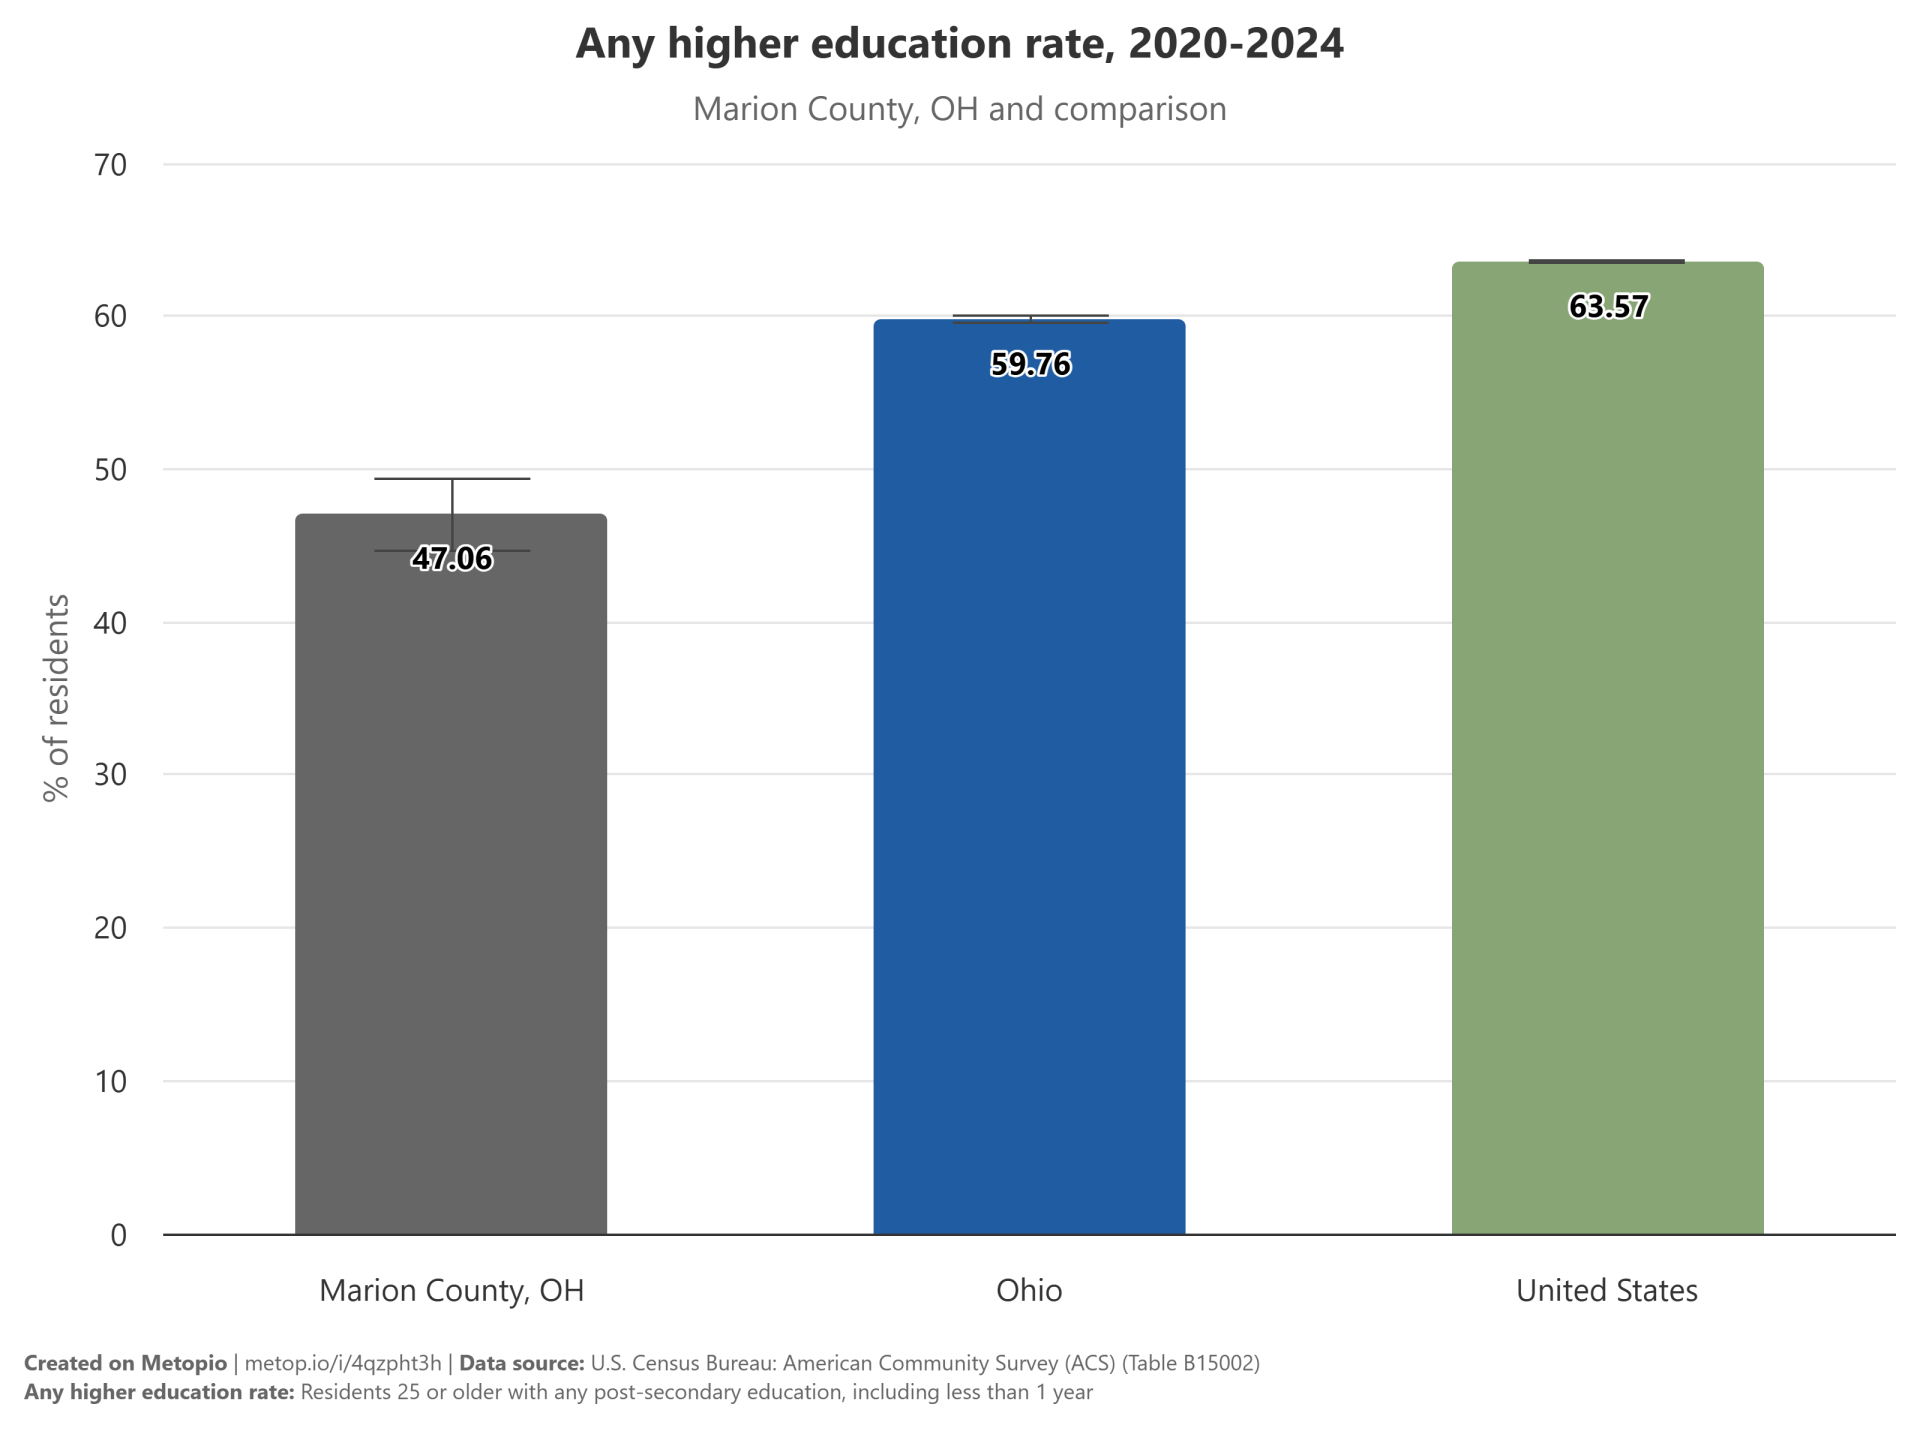
The overall rate of higher education attainment in the United States is 63.57%. However, Ohio lags behind the national average with a rate of 59.76%. Marion County, OH, has an even lower rate at 47.06%.
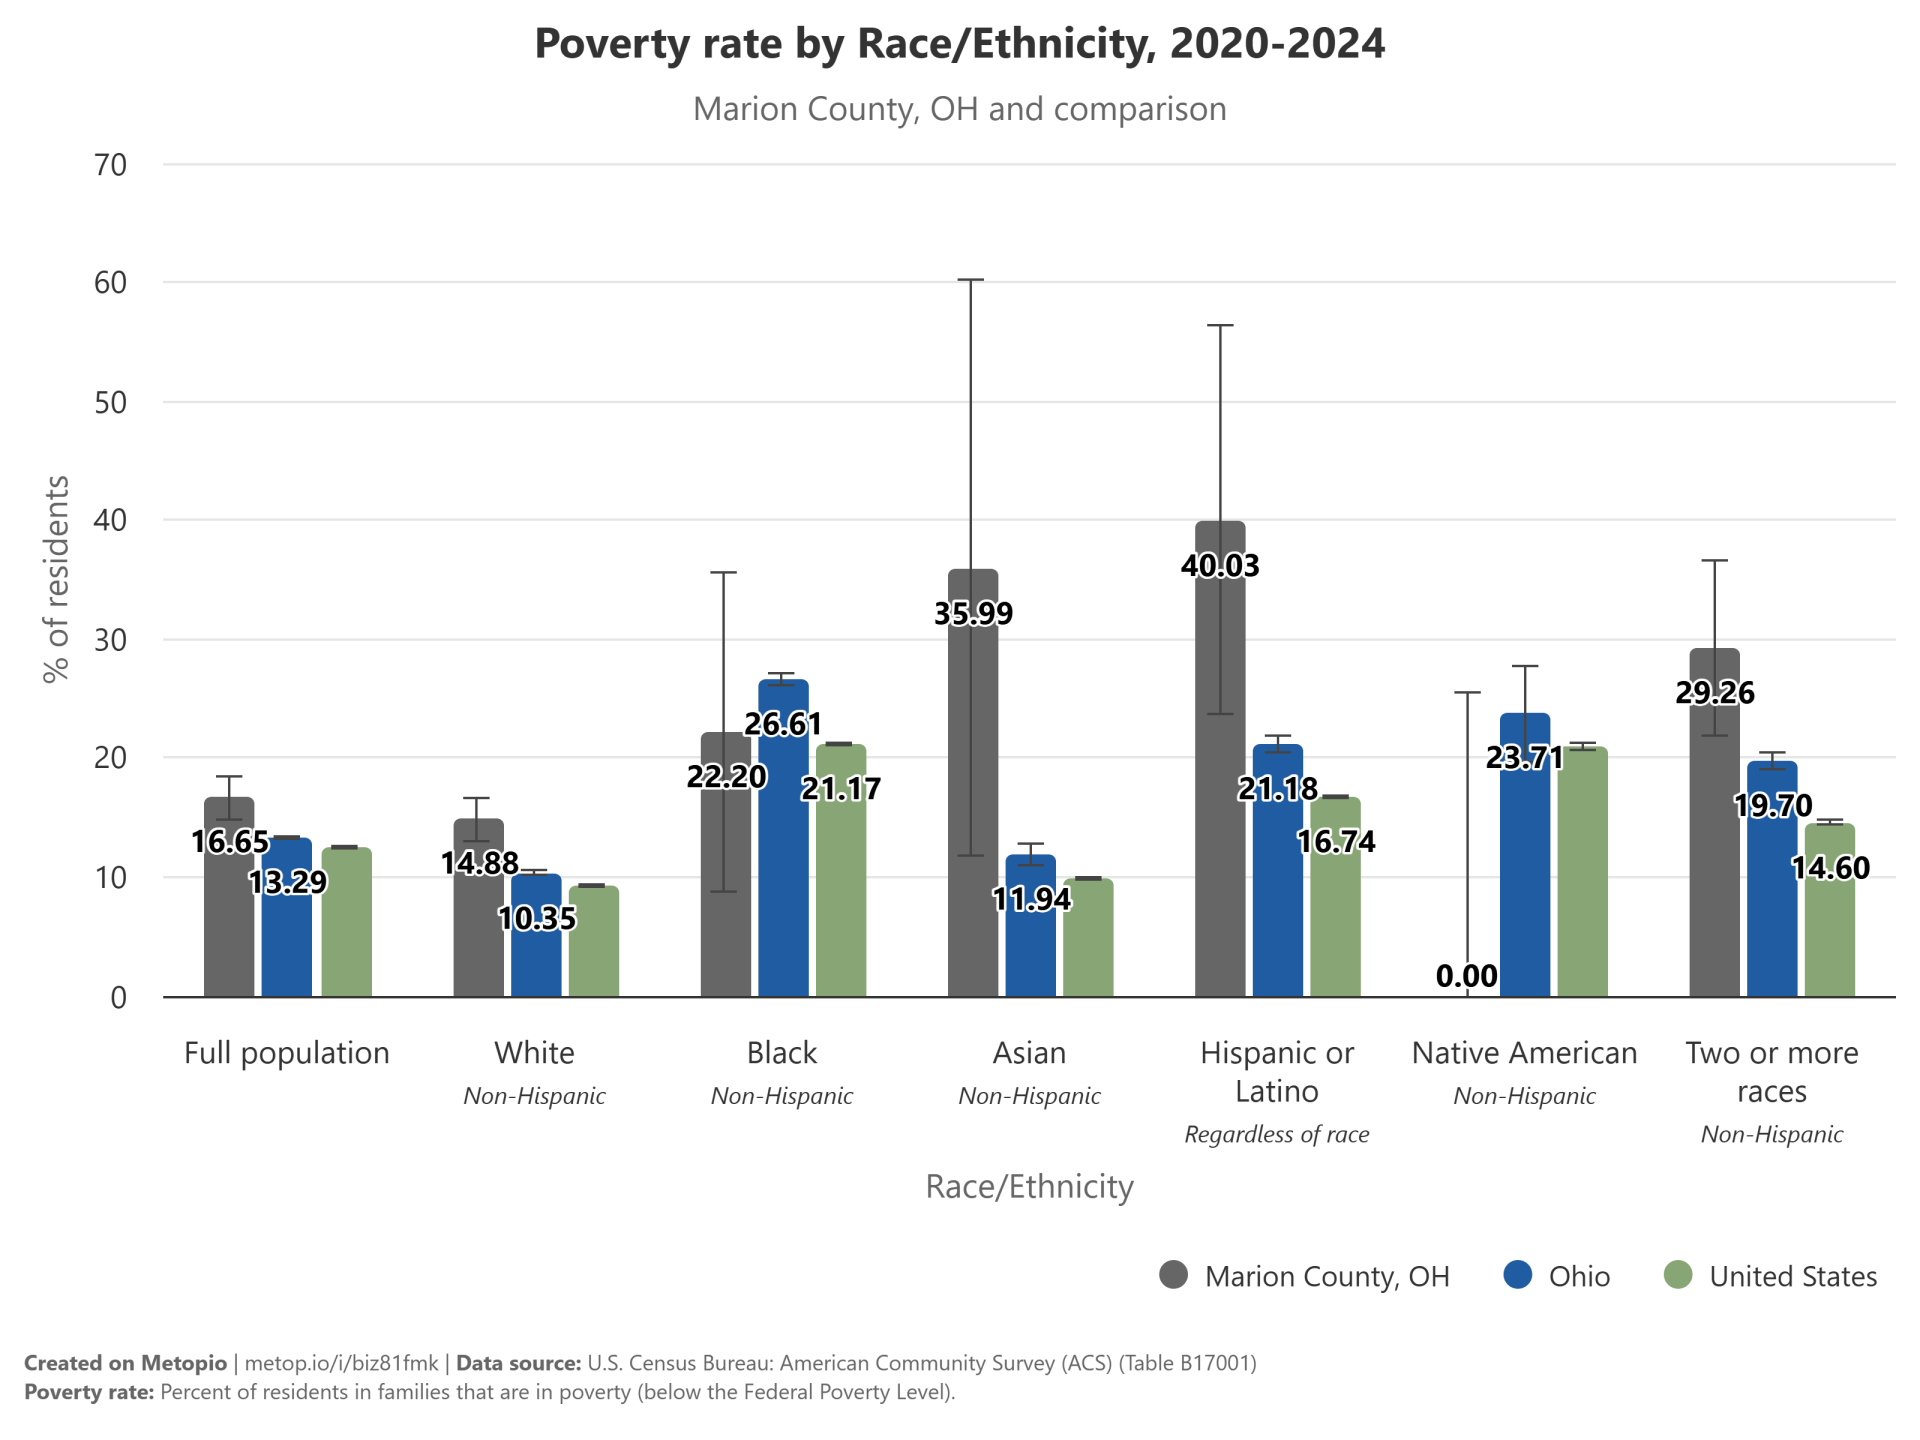
Poverty
The poverty rate in Marion County, Ohio, is notably higher for Hispanic or Latino individuals compared to the state and national averages. Asian and Two or more races populations also experience higher poverty rates in Marion County than in Ohio and the United States. Overall, Marion County has a higher poverty rate than both Ohio and the United States.
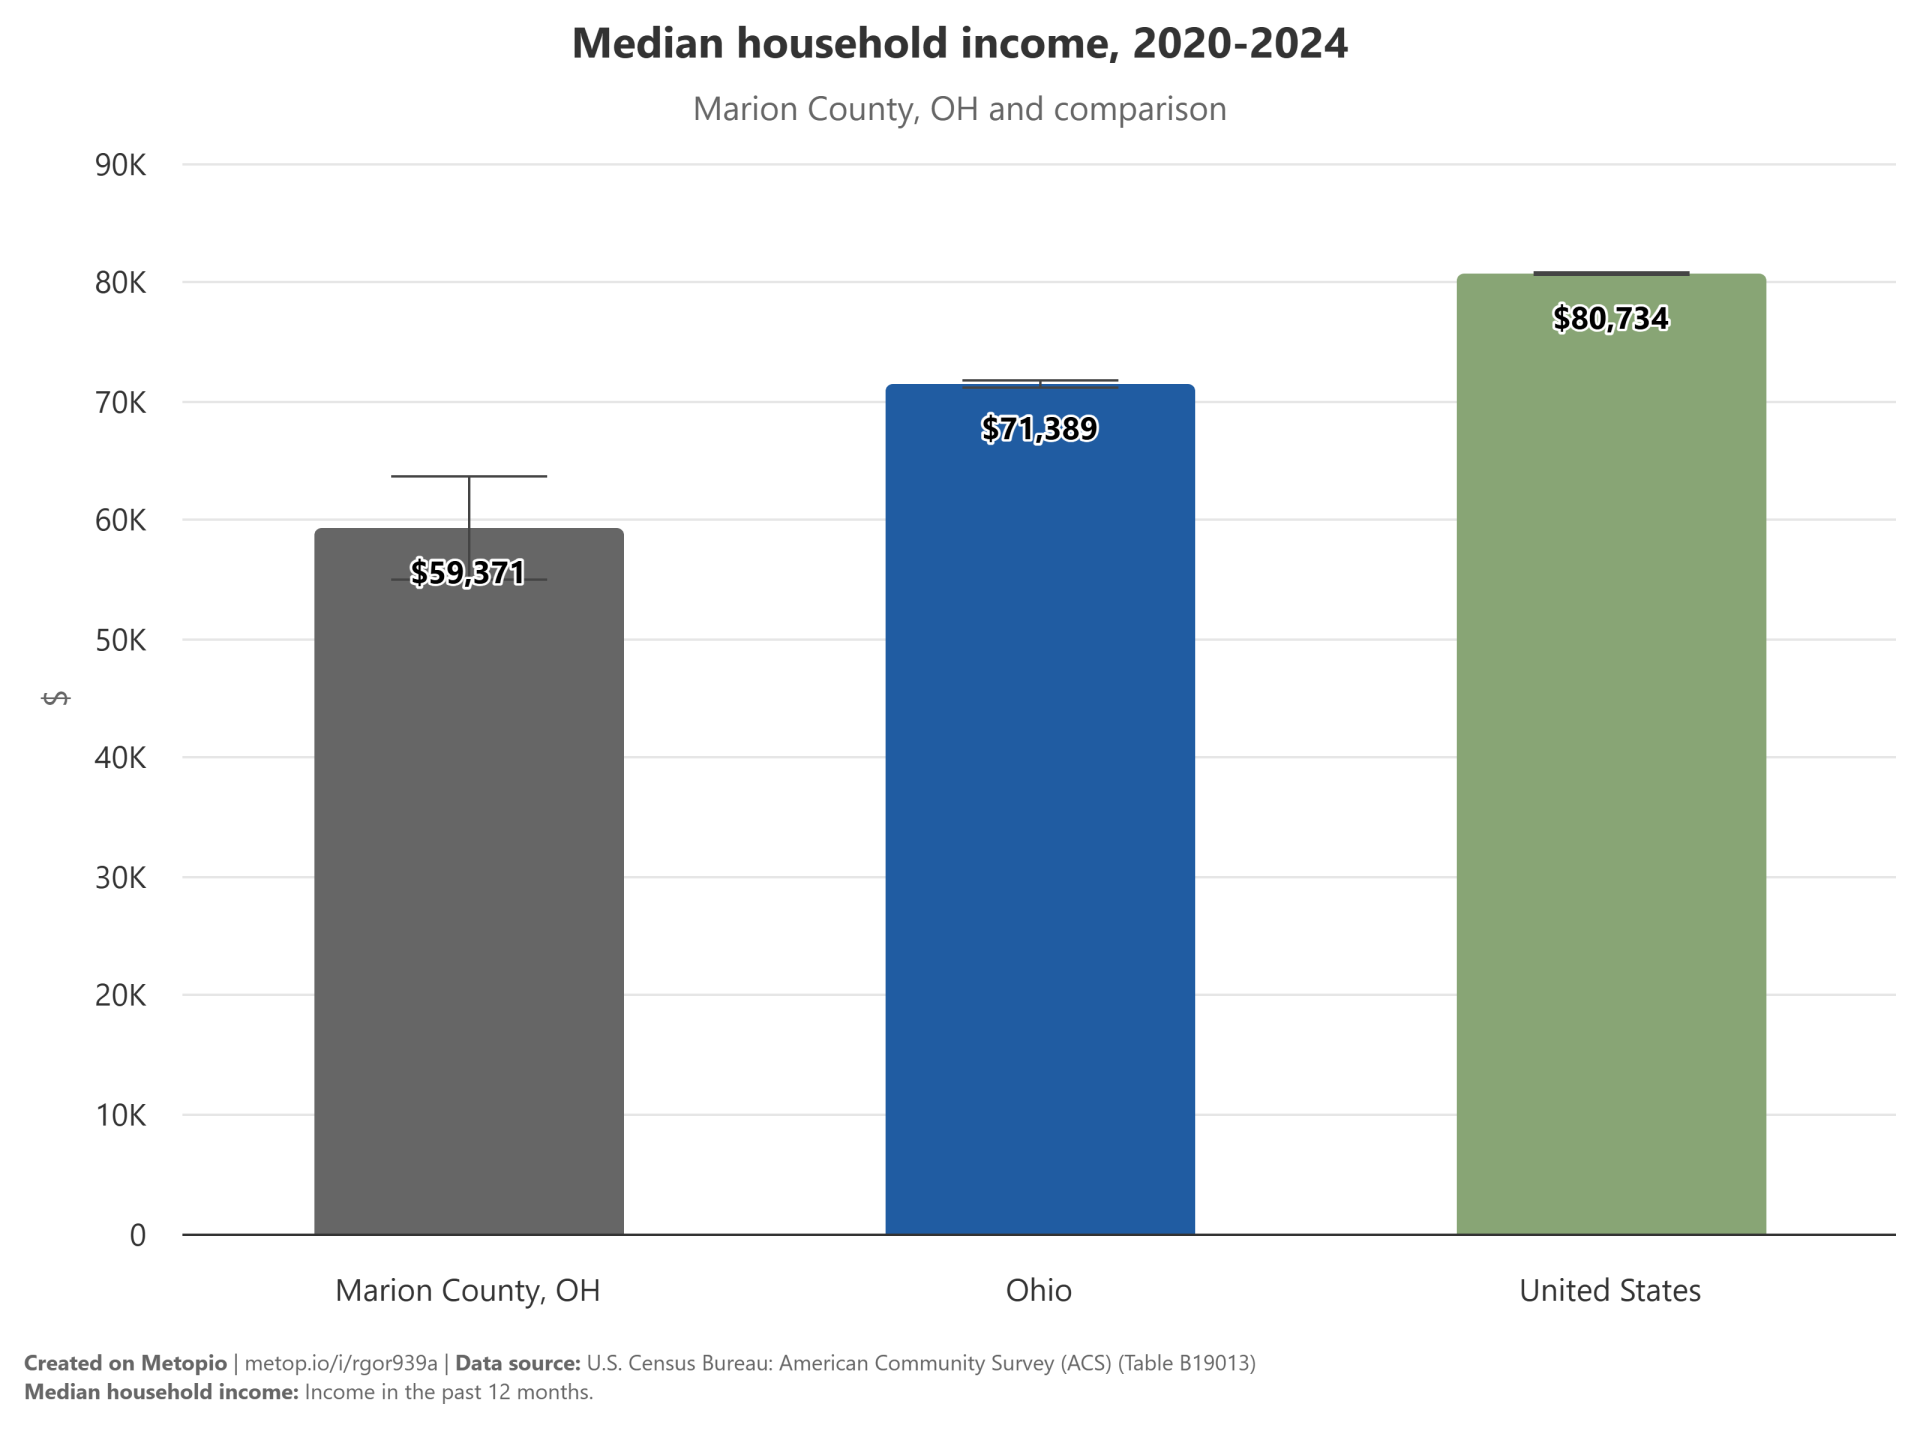
Income
The median household income in the United States is $80,734. Ohio has a lower median household income of $71,389, and Marion County, OH, has an even lower median household income of $59,371. This indicates a notable income disparity between different regions.
Behavioral Health
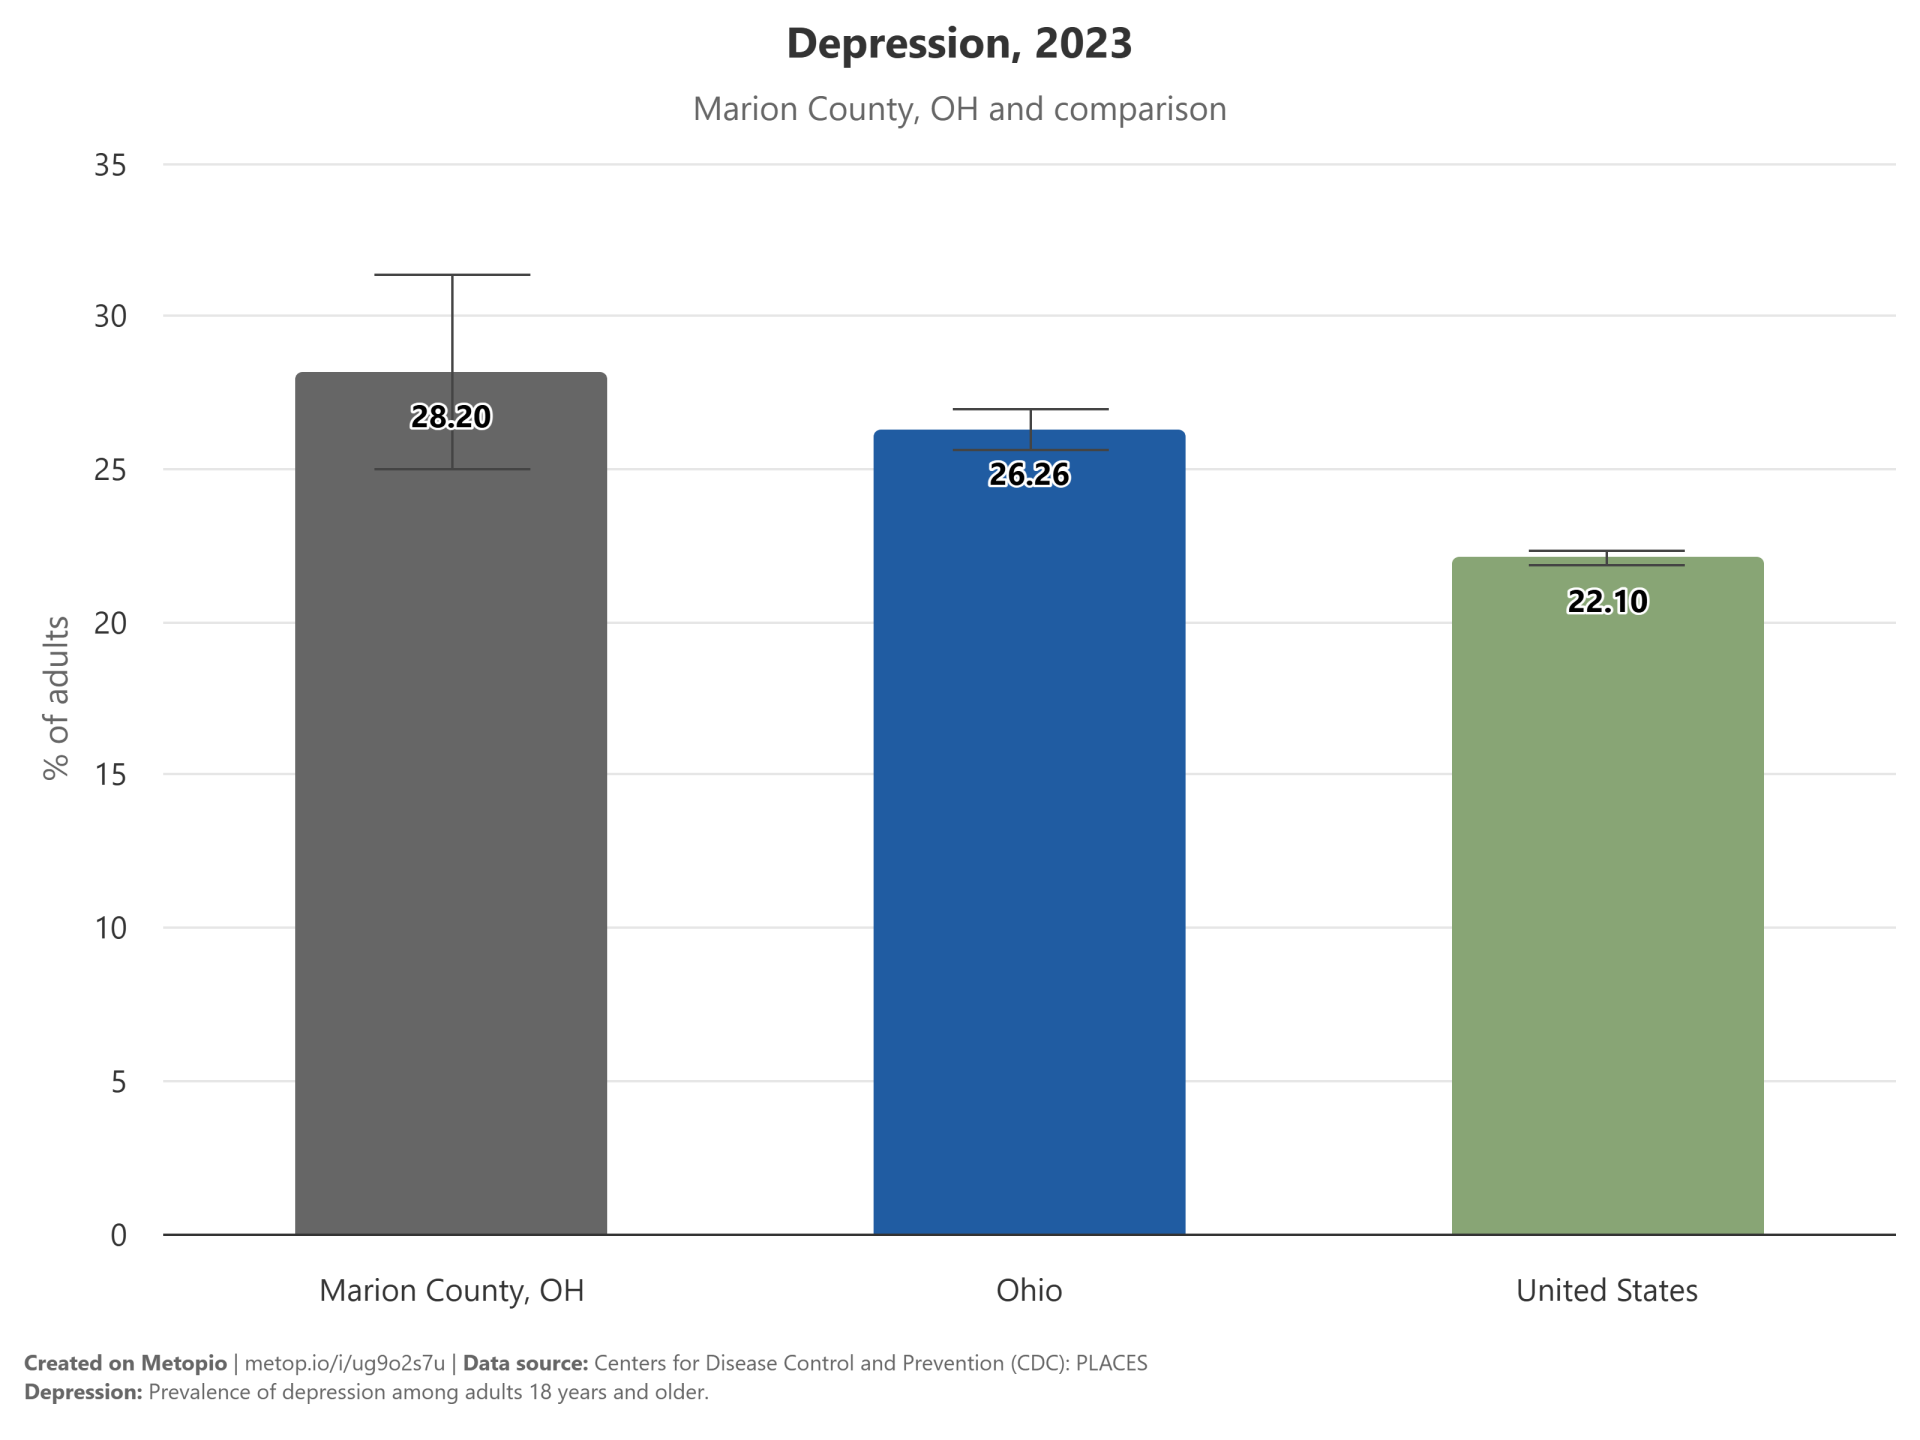
Depression
Depression rates in Marion County, OH are notably higher than the statewide average for Ohio, which itself exceeds the national average for the United States. This indicates a significant regional variation in depression prevalence.
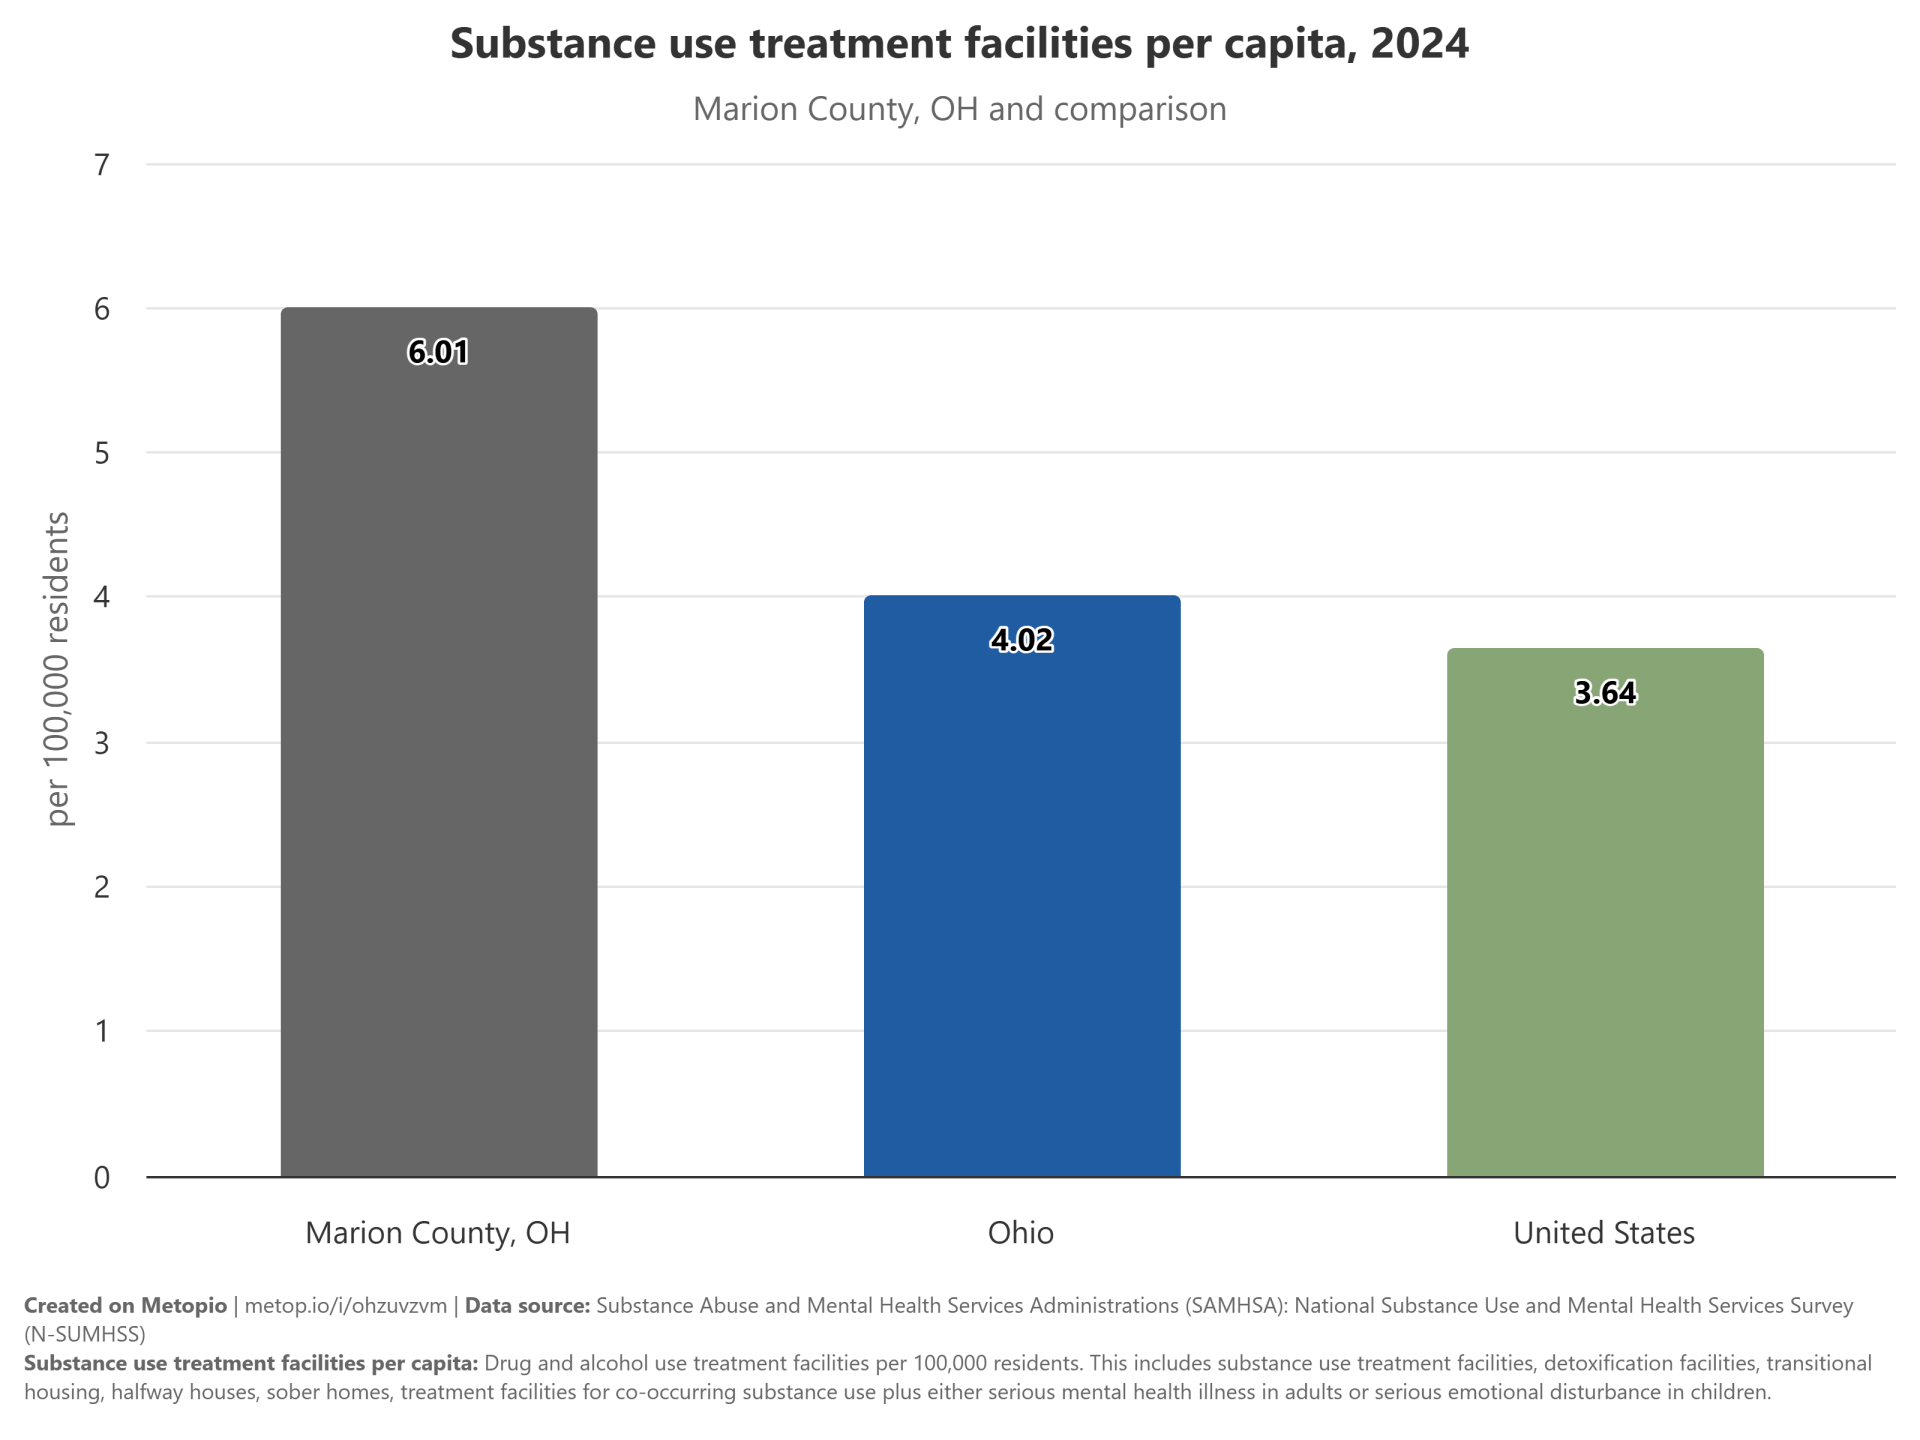
Treatment Facilities
Substance use treatment facilities per capita are notably higher in Marion County, OH compared to the overall rates in Ohio and the United States. This indicates a greater availability of treatment resources in Marion County relative to the state and national averages.
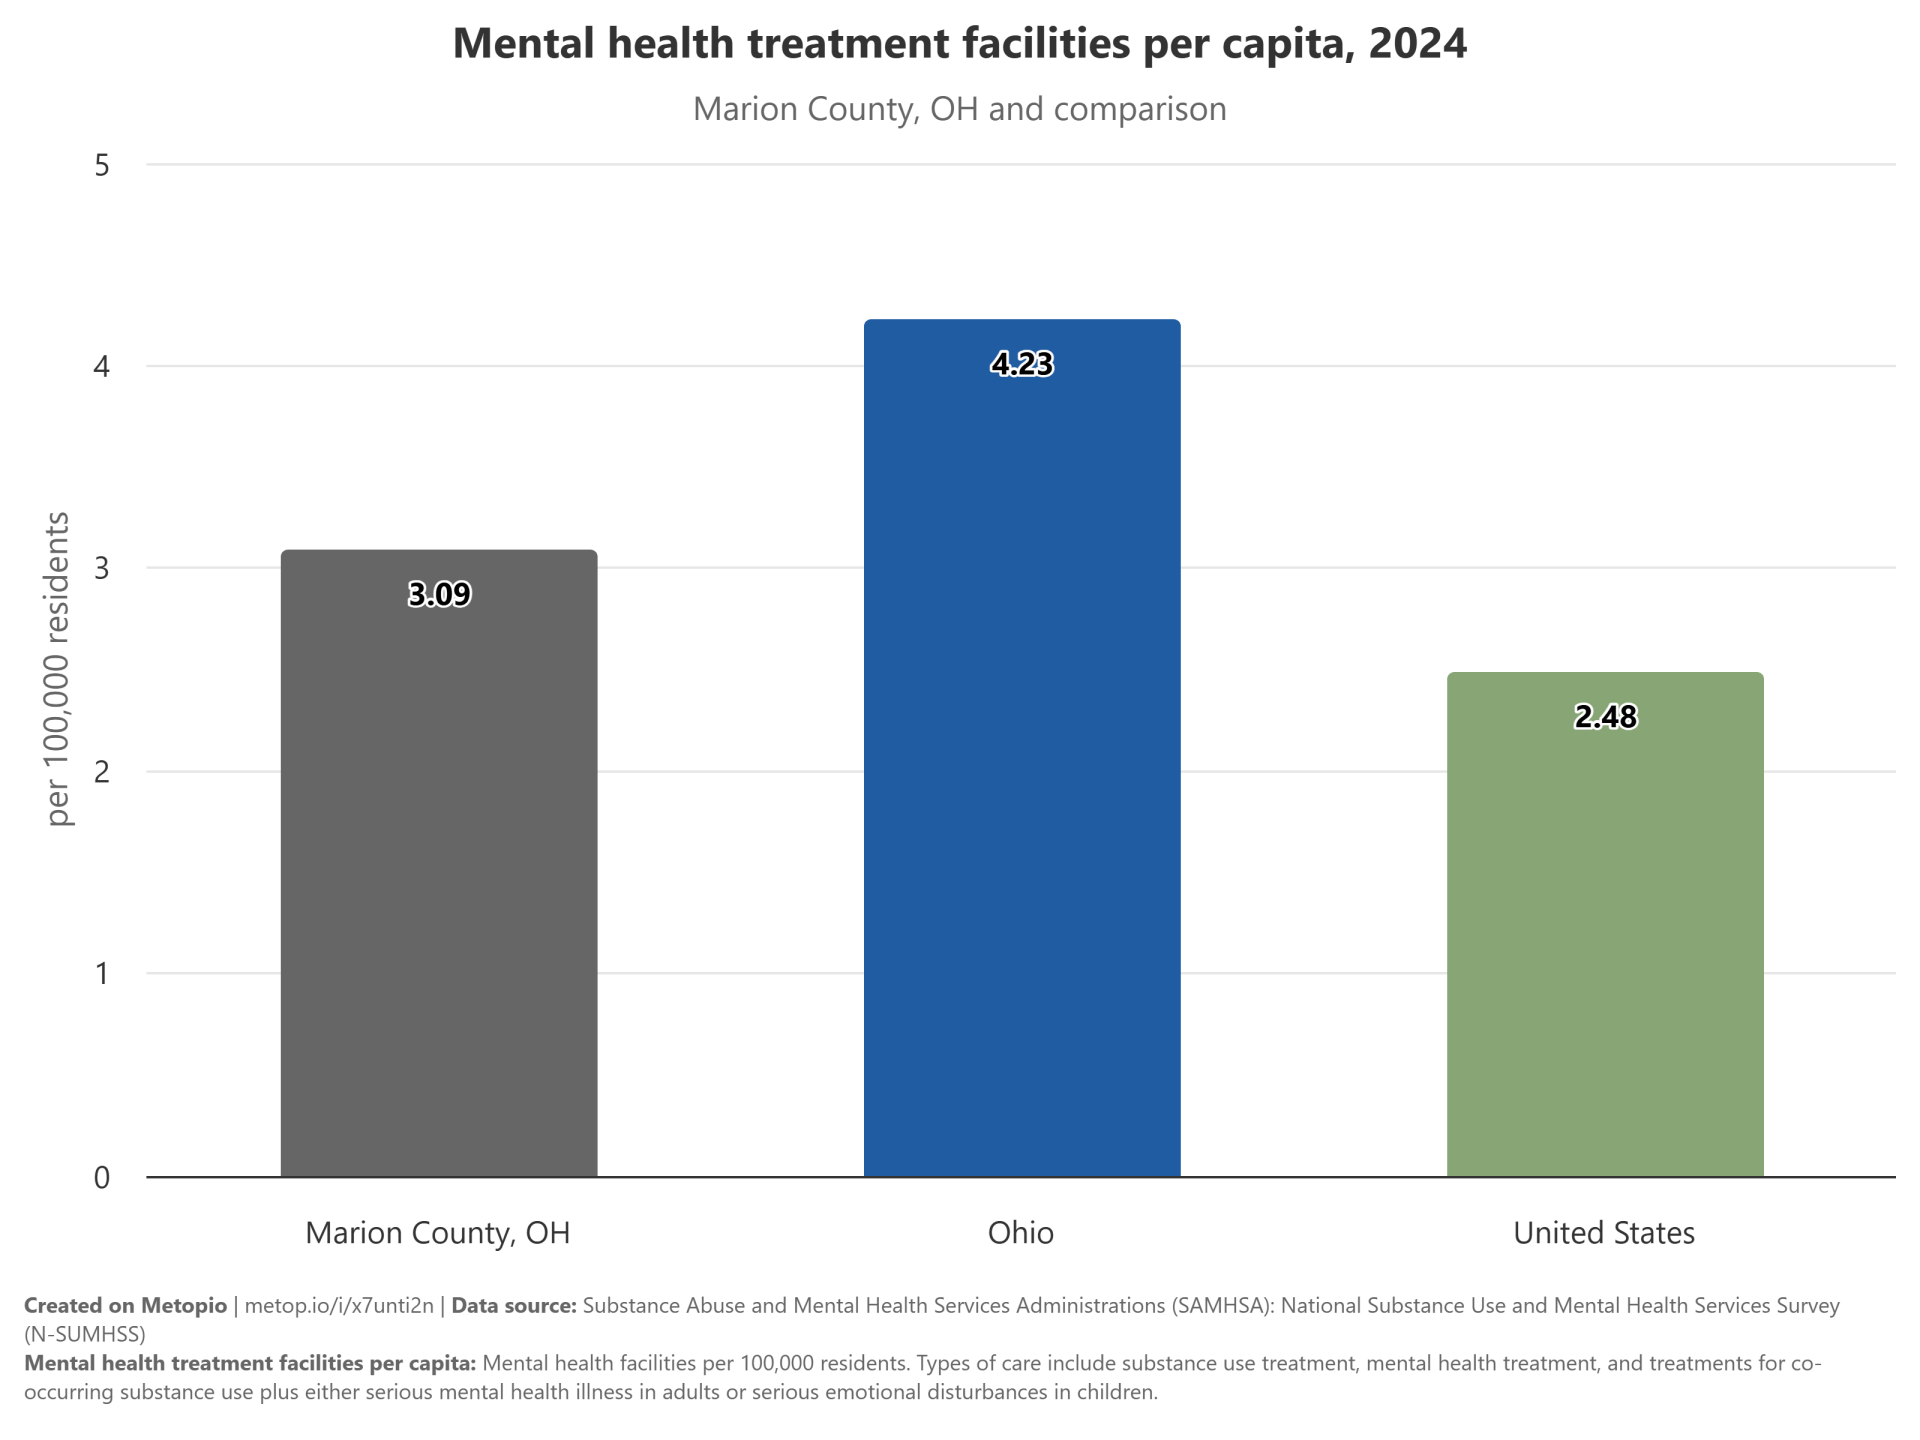
Mental health treatment facilities per capita in Ohio are significantly higher than the national average. Marion County, OH, has a lower per capita rate compared to the state average.
Marion County, OH, has a notably higher rate of opioid treatment providers per capita compared to both the state of Ohio and the United States. Ohio’s rate is also higher than the national average, indicating a greater availability of opioid treatment services in these areas. This suggests a potentially stronger focus on addressing opioid-related issues in Marion County and Ohio overall.

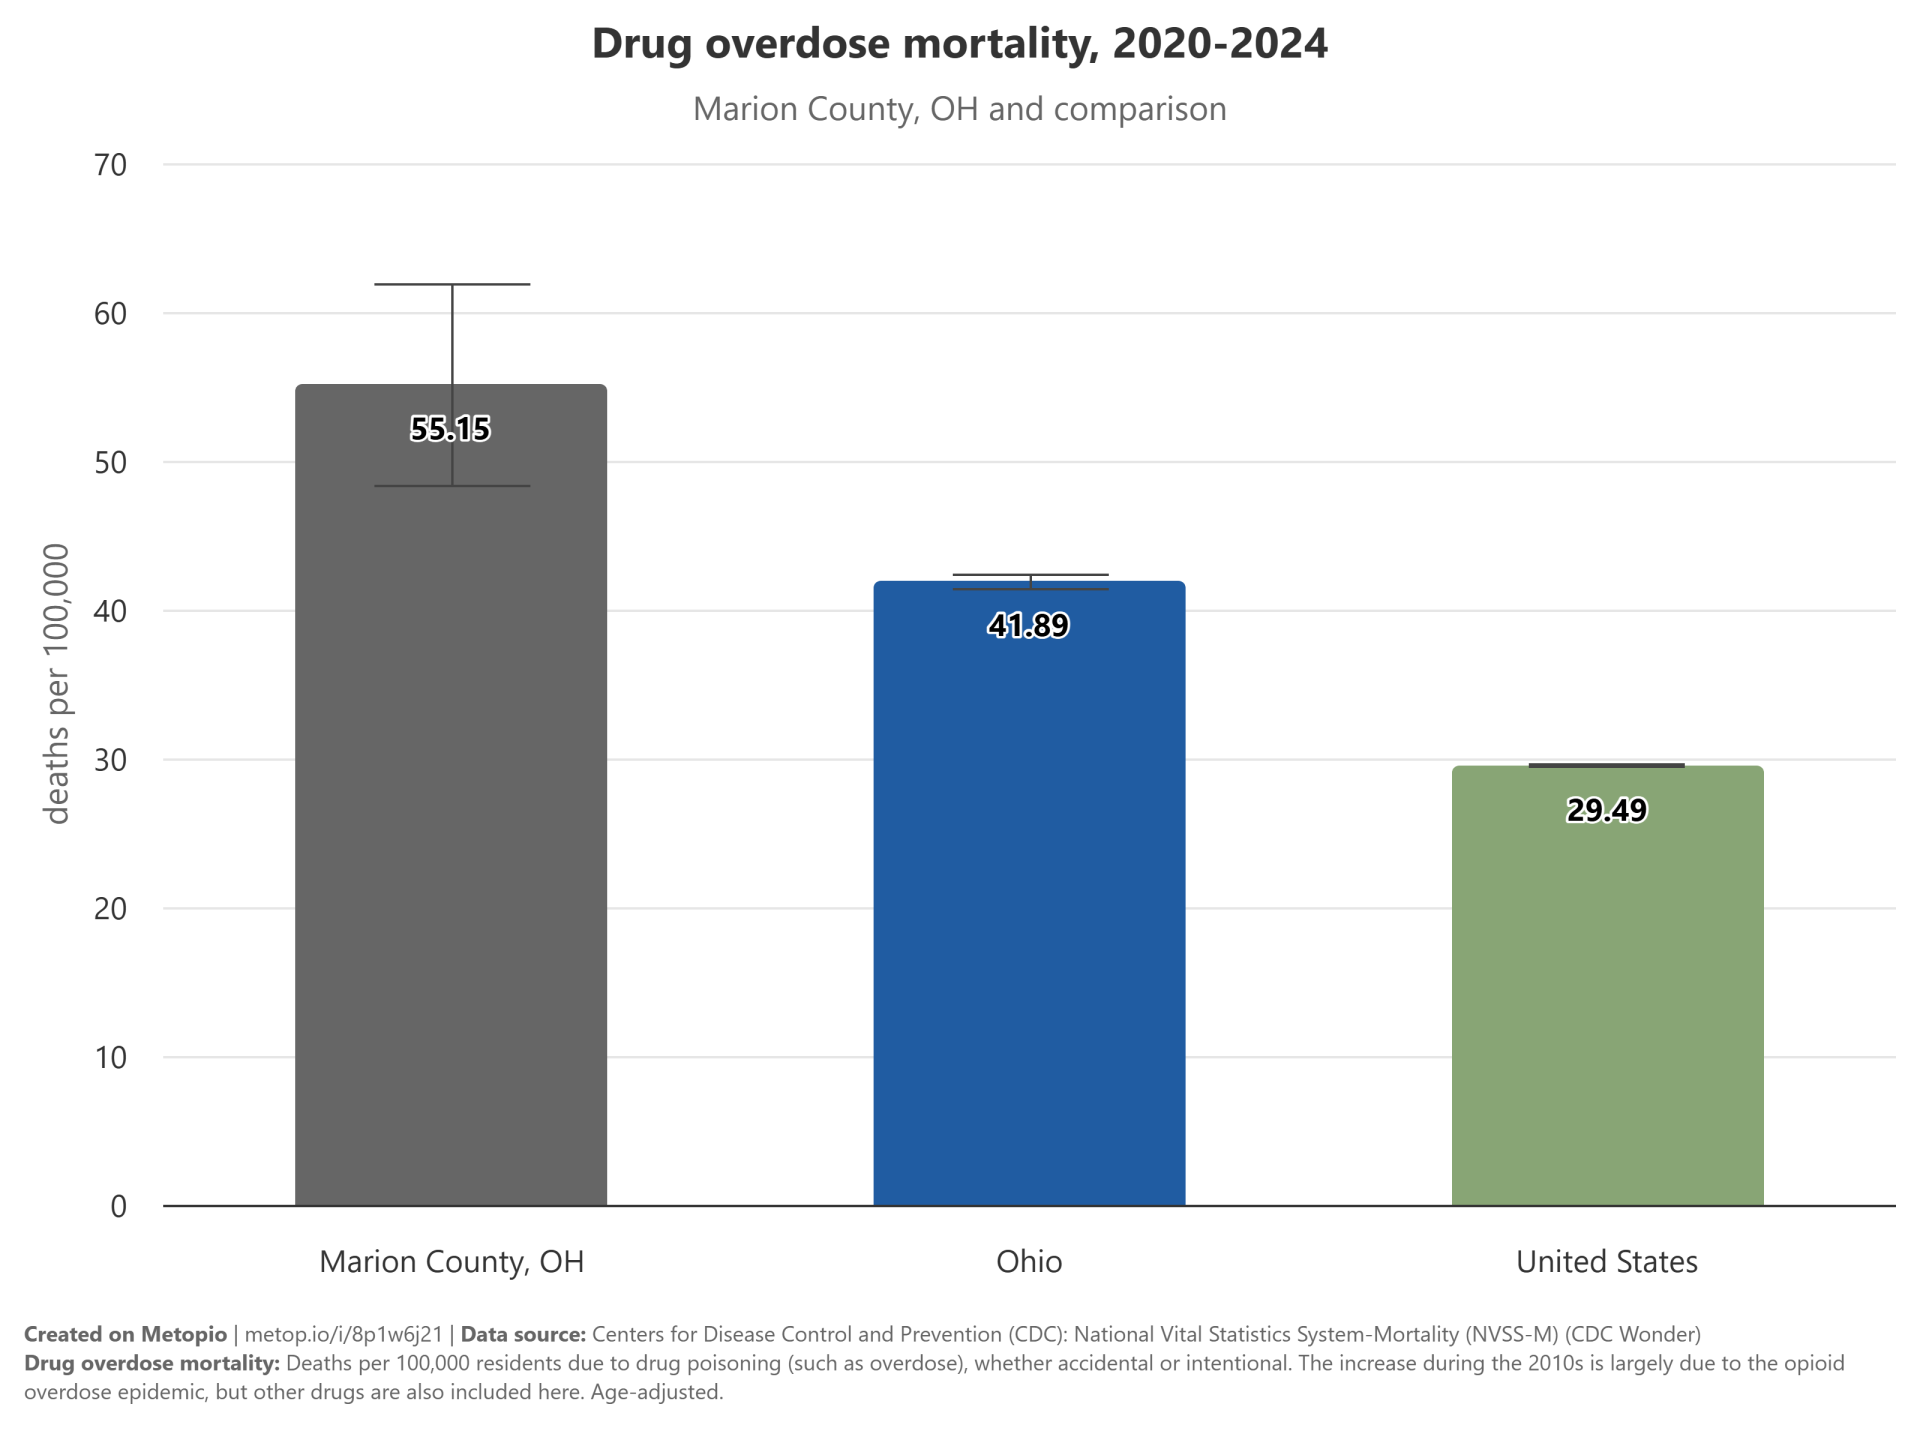
Drug Overdose
Drug overdose mortality rates vary significantly across different regions. Marion County, OH, has a notably higher rate of 55.15 per 100,000 people compared to the overall state of Ohio, which has a rate of 41.89. The United States has a lower average rate of 29.49. These disparities highlight the need for targeted interventions in specific areas to address the opioid crisis.
Built Environment
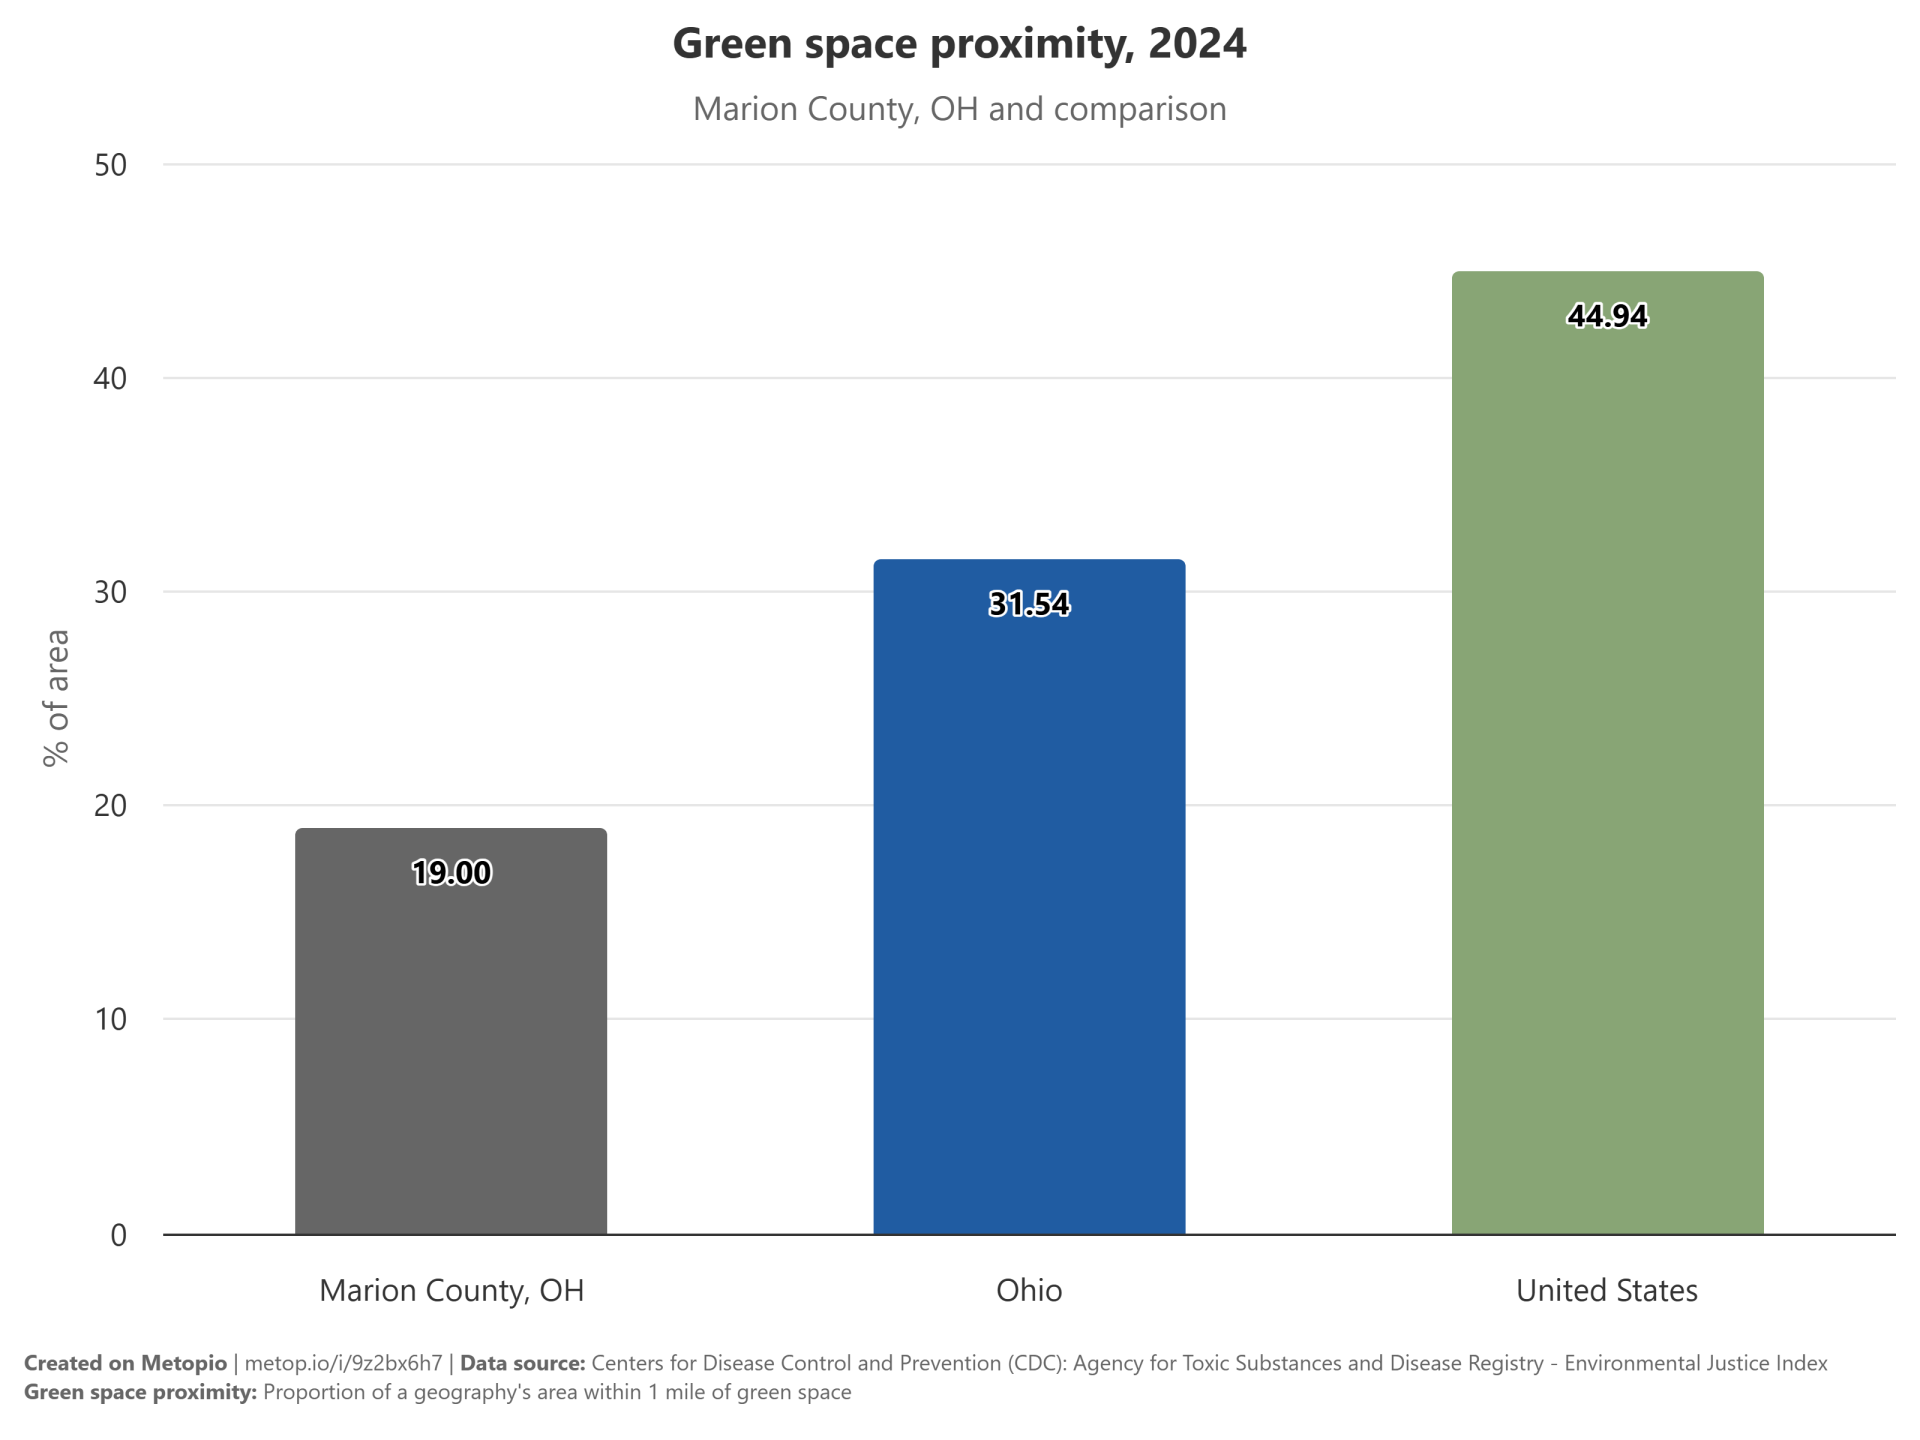
Green Space
The data reveals the average proximity to green spaces across different geographic levels in the United States. Nationally, the average proximity is 44.94, indicating a moderate level of access. However, Ohio shows a lower average of 31.54, suggesting less accessibility compared to the national average. Marion County, OH, has the lowest average proximity at 19.0, highlighting a significant disparity in green space access within the state.
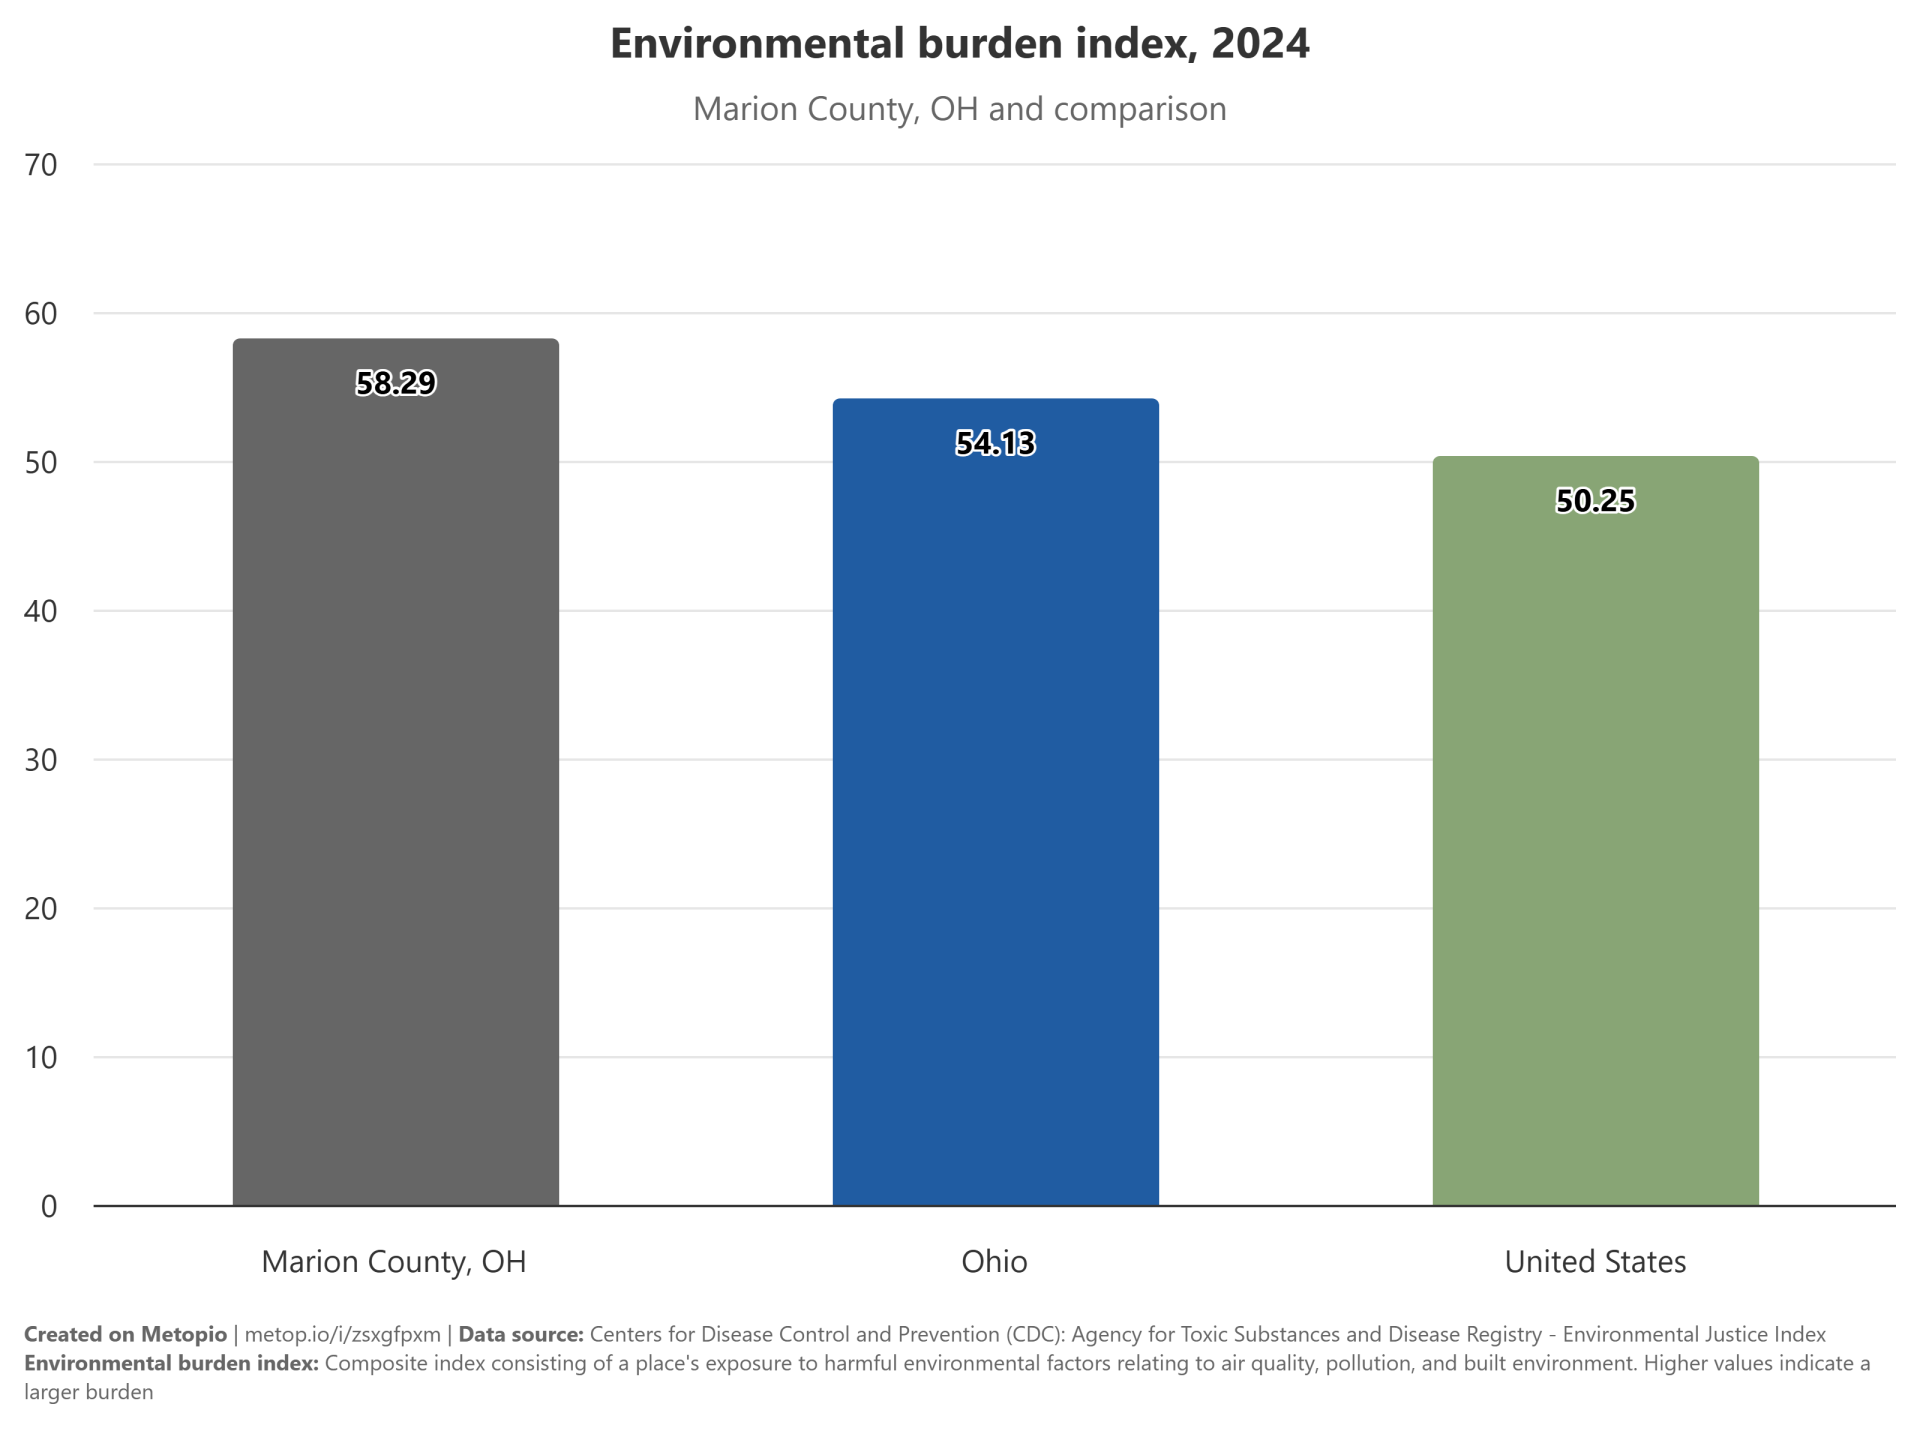
Environmental Burden
The Environmental Burden Index indicates that Marion County, OH, experiences a higher environmental burden compared to the state of Ohio and the United States as a whole. Ohio’s environmental burden is also higher than the national average, suggesting regional environmental challenges. These disparities highlight the need for targeted environmental policies and interventions.
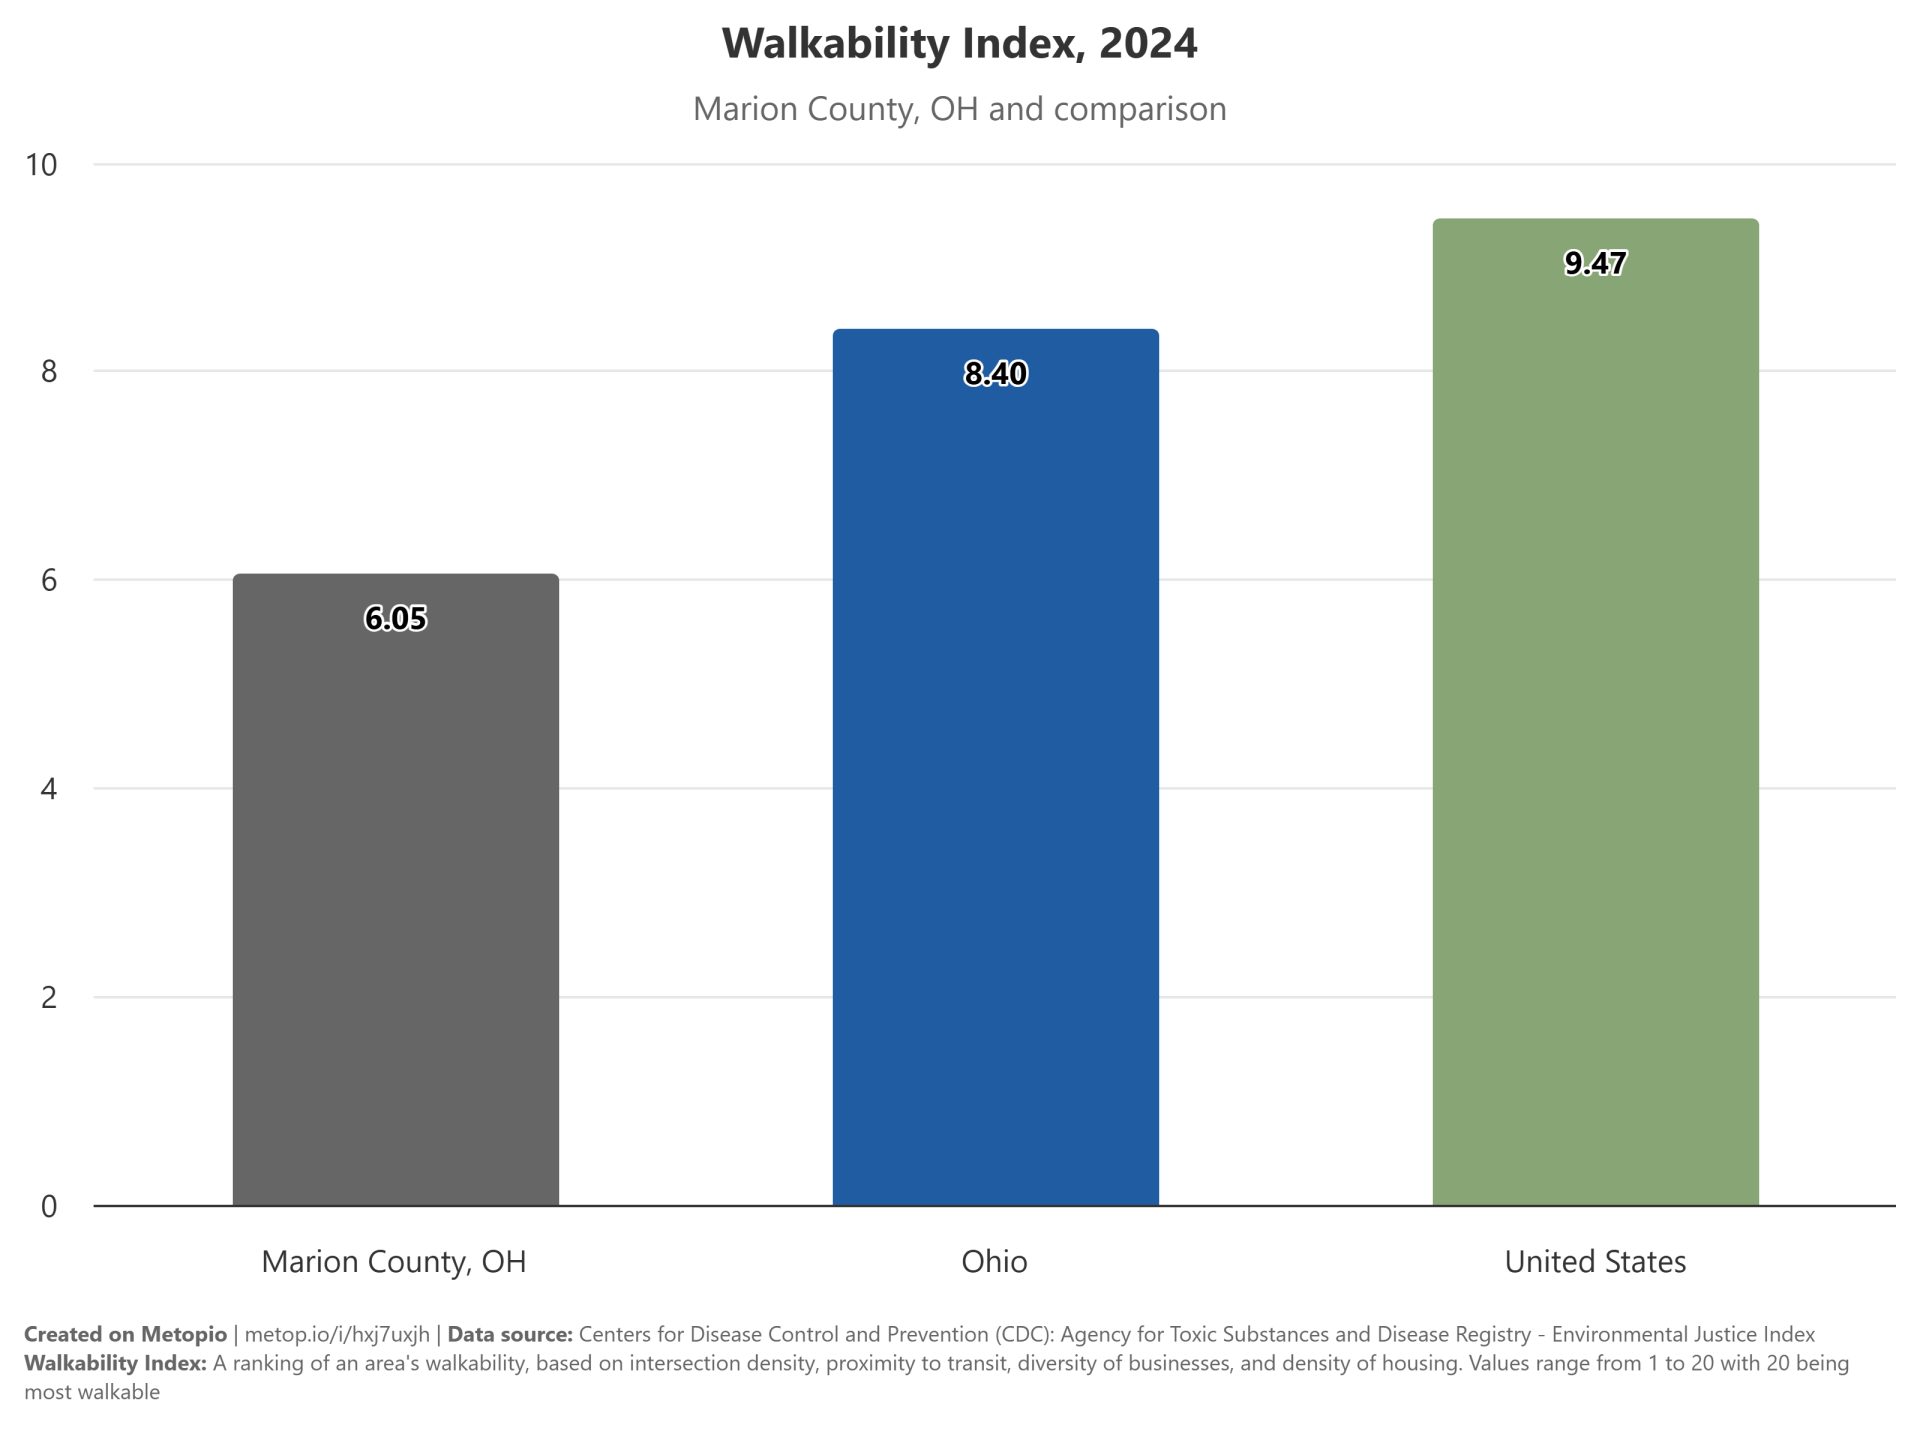
Walkability
The walkability index in the United States is 9.47, indicating a generally high level of walkability. Ohio has a slightly lower index of 8.4, suggesting a moderate level of walkability. Marion County, OH, has the lowest walkability index at 6.05, indicating a lower level of walkability compared to the state and national averages.
a
a
*Click on the charts to open them in a new tab and view them in a larger size!*
Miscellaneous Marion Reports
- Crawford, Marion, Morrow Counties Regional Coordinated Plan
- 2017 Transportation Report
- 2017 Nutrition & Physical Activity Report
Page last updated: May 5, 2026